| Business Objects |
Project (data model class "project_space") |
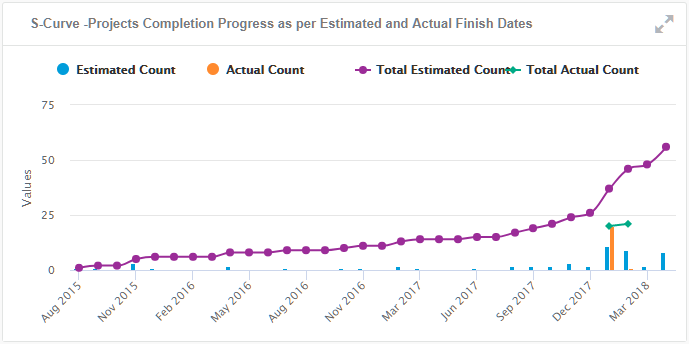
| Values (or X-Axis and Y-Axis) |
- X-Axis: timeline in week unit, based on actual and estimated time information
from
act_finish_date andest_finish_date.
- Y-Axis: columns and lines
- actual count of completed projects (
act_count).
- estimated count of completed projects (
est_count).
|
| Sorting |
The results are chronologically sorted, from oldest to newest. |
| Limits |
There is no limit on time. |
| Colors |
Colors cannot be configured. |
| Available Views |
Combined bar and line chart, full screen chart. |
| Interactions |
On this chart, you can:
- Click the line or column to show only the selected element over time.
- Draw a rectangular area on the chart using drag-and-drop zooms on this
area.
- Click
 to
switch to fullscreen display. to
switch to fullscreen display.
|
| Technical Details |
- Data model
-
Class: project_space
- Inherited from
project
- Property:
project_estimated_finish_date
- Property:
project_actual_finish_date
- Mashup feed (
project)
est_finish_date dynamic date facet is defined with:
- expression:
#extract(document_ram_datetime,"project_estimated_finish_date")
- aggregation:
est_count = SUM(1)
act_finish_date dynamic date facet is defined with:
- expression:
#extract(document_ram_datetime,"project_actual_finish_date")
- aggregation:
act_count = SUM(1)
|