Demand Vs Allocation | ||
| ||
| Business Objects |
Allocated Resource (data model class " Resource Request (data model class " |
| Values (or X-Axis and Y-Axis) |
|
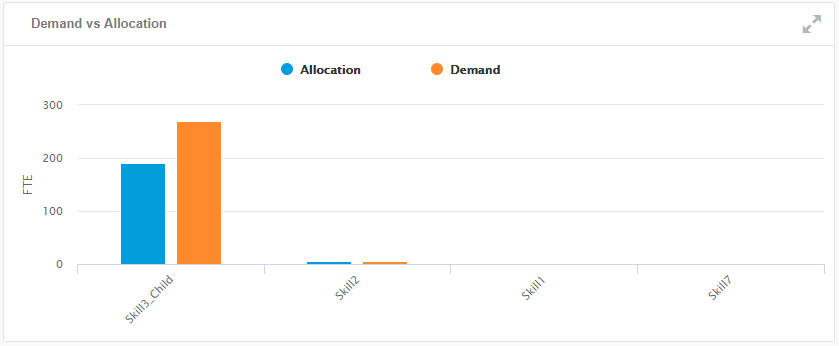
| Sorting | The results are sorted by descending COUNT, summed for all projects. |
| Limits | By default, only 12 skills are displayed. Note:
You can change the pagination to
display all the categories by clicking the menu
 . . |
| Colors | Colors are blue for allocations and orange for requests. |
| Available Views | Bar chart. |
| Interactions | On this chart, you can:
|
| Technical Details |
|
 to
switch to fullscreen display.
to
switch to fullscreen display.