| Business Objects |
Allocated Resource (data model class "allocated_resource")
Resource Request (data model class "resource_request")
|
| Values (or X-Axis and Y-Axis) |
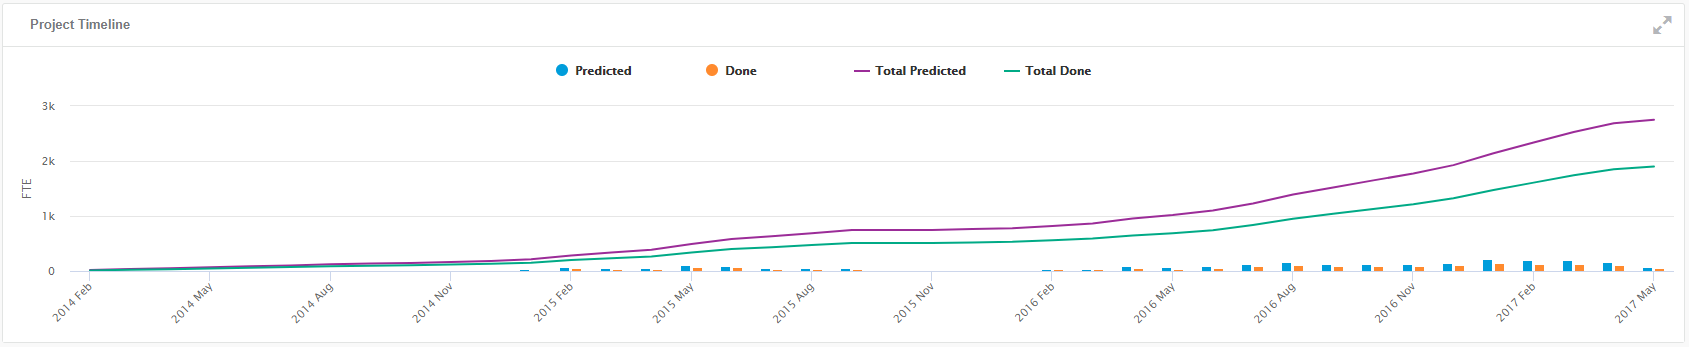
- X-Axis: Month and year (
resource_fte_monthofyear).
- Y-Axis: FTE (
resource_rel_fte).
|
| Sorting |
The results are sorted by date. |
| Limits |
There is no limit. |
| Colors |
Colors can be configured in Preferences. For more
information, see Configuring Facet Displays. |
| Available Views |
Bar Chart for month value and Line Chart for cumulative values. |
| Interactions |
On this chart, you can:
- Click
 to
switch to fullscreen display. to
switch to fullscreen display.
|
| Technical Details |
-
Data model
- Class: resource
- Property:
resource_fte_monthofyear
- Property:
resource_rel_fte
- Data Processing
- SimpleDateFormatterDocProc: Transform
resource_fte_monthofyear
into date by adding day 01
- Mashup feed (allocated)
- Aggregations added on facet
resource_fte_monthofyear
- allocated:
                              SUM(#has_category("Top/classproperties/type/allocated", categories) ?
                              resource_rel_fte : 0)
- request:
 SUM(#has_category("Top/classproperties/type/resource
                              plan", categories) ? resource_rel_fte : 0)
|