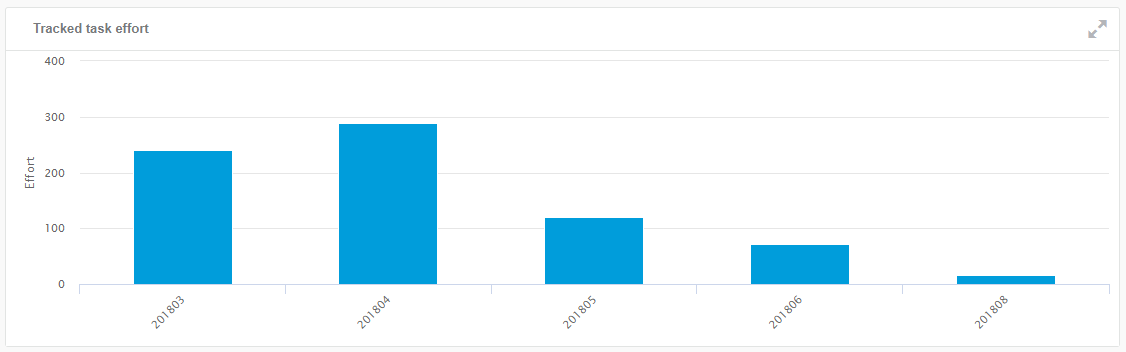
| Business Objects |
Effort (data model class "effort") |
| Values (or X-Axis and Y-Axis) |
- X-Axis: Effort (
effort_total_effort).
- Y-Axis: Week of the year.
|
| Sorting |
The results are sorted by date, from oldest to newest result. |
| Limits |
There is no limit. |
| Colors |
The chart is blue. |
| Available Views |
Bar chart. |
| Interactions |
On this chart, you can:
- Click
 to
switch to fullscreen display. to
switch to fullscreen display.
|
| Technical Details |
-
Data model
- Class: effort
- Property:
effort_woy_effort
- Property:
effort_total_effort
- Mashup feed (effort)
- Aggregations added on facet
effort_woy_effort
- complete:
SUM(effort_total_effort)
|