| Business Objects |
Risk (data model class "risk") |
| Values (or X-Axis and Y-Axis) |
- X-Axis: timeline (week unit), based on
history_weekofyear
facet
- Value and Y-Axis of timeline: aggregation value corresponding respectively to
SUM of
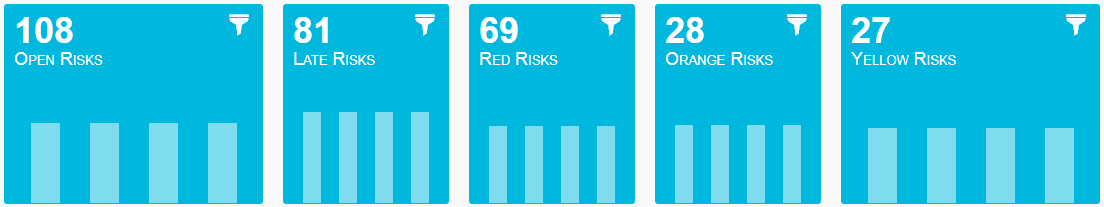
- Open risks:
snapshot documents
(document_history_type field) without
complete category on facet current
- Late risks:
snapshot documents
(document_history_type field) without
complete category on facet current and
with project_estimated_finish_date before
now
- Red risks:
snapshot documents
(document_history_type field) without
complete category on facet current and
with red probability-impact on combination of facets
probability and impact
- Orange risks:
snapshot documents
(document_history_type field) without
complete category on facet current and
with orange probability-impact on combination of facets
probability and impact
- Yellow risks:
snapshot documents
(document_history_type field) without
complete category on facet current and
with yellow probability-impact on combination of facets
probability and impact
|
| Sorting |
The results are sorted by time, the most recent on the right of the
chart. |
| Limits |
Only the last 12 weeks are displayed. |
| Colors |
The color of this chart is customizable and predefined to green, blue, orange,
and red for count of respectively [0; 0.5[, [0.5; 1[, [1; 1.5[, [1.5;
100000[. |
| Available Views |
Indicator values with history. |
| Interactions |
On this chart, you can click the filter icon to refine dashboard on (respectively):
- Open risks
- Late risks
- Red risks
- Orange risks
- Yellow risks
|
| Technical Details |
-
Consolidation
- These indicators rely on snapshots computed by
project_
getProjectHistoryFromEnovia aggregation
processor
- Data model
- Class: risk (or inherited)
- Property:
document_history_datetime
- Property:
document_history_type
- Property:
project_estimated_finish_date
- Mashup feed:
project_history
|