| Business Objects |
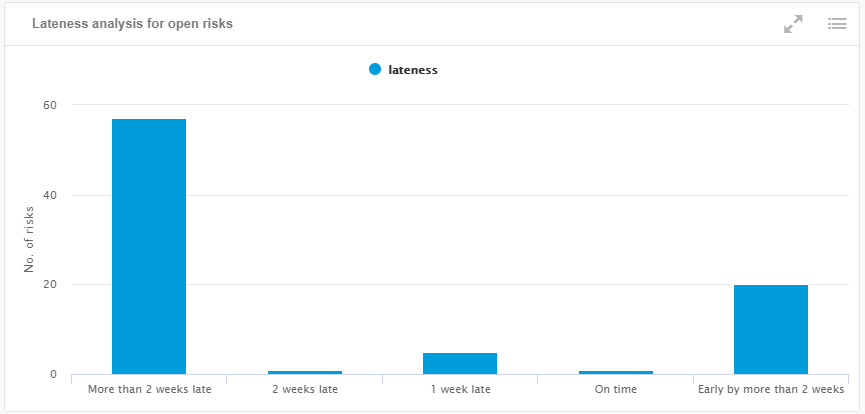
Risk (data model class "risk") |
| Values (or X-Axis and Y-Axis) |
- X-Axis: risk lateness ranges (either on time, early or late, by 1, 2 or more
weeks)
- Y-Axis: Number of open risks
|
| Sorting |
The results are sorted in this order:
- Early by more than 2 weeks
- 2 weeks early
- 1 week early
- On time
- 1 week late
- 2 weeks late
- More than 2 weeks late
|
| Limits |
There is no limit. |
| Colors |
The color of this chart is blue and is configured in
Preferences. For more information, see Configuring Facet Displays. |
| Available Views |
Bar chart, table. |
| Interactions |
On this chart, you can:
- Click the bars to filter on corresponding project
- Click
 to
switch to fullscreen display to
switch to fullscreen display
- Click
 to switch
to table display to switch
to table display
|
| Technical Details |
|