About Interactive Simulation Monitoring | ||||
|
| |||
When you run a simulation in interactive mode from a simulation app, the app opens the Simulation Status dialog box. This dialog box provides status information and other tools that you can use to monitor the progress of your simulation. The information in this dialog box is updated as the simulation progresses, and you can examine error messages or warnings or review the iteration history of the analysis.

For simulations with multiple analysis cases, the monitoring resources in the dialog box are organized into two hierarchies of tabs:
- A top-level tab is displayed for each analysis case and enables you to monitor the progress of that analysis case.
- Within each analysis case tab, a set of simulation monitoring tabs provide information about the progress of that particular analysis case.
For simulations with only one analysis case, the simulation monitoring tabs appear at the top level of the dialog box. The tabs include the following information:
Messages
You can access the errors, warnings, and informational messages that are generated by the simulation job. In many cases, if a particular region of the model is causing the error or warning, the message includes a hyperlink that you can click to highlight that region in the viewport.
Licensing messages
Licensing information is available only when you are running under a cloud role. It describes how many credits or tokens have been consumed by the simulation.
Plots
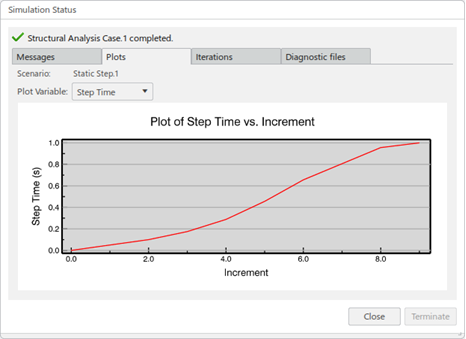
Plots provide a graphical display of how the simulation is progressing. In the example shown below, the plot of step time vs. increments enables you to see whether the time elapsed for each increment is trending up or down.
The full set of available plots depends on the type of simulation you are running.

Iterations
You can view a table showing several data points about the progress of the simulation at each iteration.
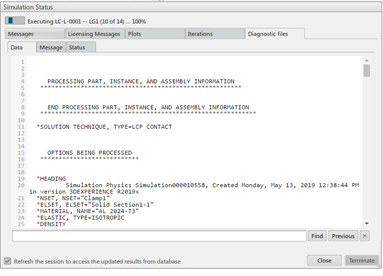
Diagnostic files
As the simulation proceeds, the solver generates diagnostic files that provide more information about its progress and about your model. You can review each of these diagnostic files:
| Tab | Contents |
|---|---|
| Data | The data file (.dat) provides information about the model definition (generated by the analysis input file processor) and, for implicit analyses, tabular output of results. The analysis input file processor information includes the model definition, the history definition, and messages identifying any error and warning conditions that were detected while processing the input data. |
| Message | The message file provides diagnostic messages about the progress of the solution. (Different contents for implicit and explicit simulations.) |
| Status | The status file contains information about the progress of an analysis. (For Abaqus analyses only) |