-
Adjust the view of your model as necessary.
The results images in the report are based on the current
view of the model.
-
From the section of
the action bar, click Report
 . .
If no report exists for this simulation, the Report
Definition dialog box appears. If a report does exist for this
simulation, you will first be prompted to retrieve the report or recreate it.
Click Retrieve to display the existing report in
Microsoft Word, or click Recreate to generate a new one.
-
Specify the report template you want to use. By default, the
report is generated using the default
SIMULIA
Microsoft Word template.
You can customize the appearance of your plots by editing the
template that stores the structure of the report. You cannot modify the
XML-like elements in the template, but you can change the format of the report;
for example, you can modify the page orientation, fonts, foreground and
background colors, and resize the tables. The default
SIMULIA
Microsoft Word and Microsoft Powerpoint templates are stored in
win_b64\reffiles\SimulationProducts\ReportTemplates.
-
Specify a graphics file you want to display as the logo for your
company or organization.
-
From the remaining
General options, select the items to include
in the report and specify the relevant information in the appropriate field.
General information about your organization is included on
the first page of the report and in the header and footer for subsequent pages.
-
From the
Sections options, select the section-related
information to include in the report, such as loads and material and mesh
properties.
-
From the
Results options, select the
you want to include in the report.
-
Click OK.
The report is generated and displayed in Microsoft Word or Microsoft
Powerpoint.
-
To update the images in the report, adjust the view of the model,
and click
 again. again.
A new report with images based on the current model view
overwrites the old report.
-
To display a previously created report during the same session, click
Report
 again and click
Retrieve from the dialog box that appears. again and click
Retrieve from the dialog box that appears.
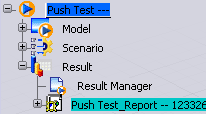
If you save the simulation, the app saves the report as a document attached to the simulation object. You can
access the report under the Result node in the Simulation Finder
app.

|