Statistics | |
| |
General
The General section contains options common to all statistics reporting operations:

- Buffer's size
- Sets the buffer file size in Kbytes. The log file is only written to disk once the log file size exceeds the buffer size you set. Buffer size is limited to 1024KB (1 MB).
- File's maximum size
Sets the maximum size of the log file in the Output directory specified for each statistics thematic.
Each time this size is exceeded, this file is moved to the location you specify in the Path to store copies field and a new file is created.
The file size is limited to 2.097.152KB (2 GB).- Maximum number of copies
- Sets the maximum number of copies of the statistics file that can be stored on the disk. Once the maximum number of copies is reached, the oldest log file is deleted. The number of copies is limited to 999 (you can only enter 3 digits in the field).
- Path to store copies
-
The default path is ${CATTemp}.
If the maximum number of copies is set to 0, this path is not used. Statistics are only stored in the Output directory specified for each statistics thematic.
- Enable Statistics Event Scheduling option
-
Allows you to track the beginning and the end of statistics events and then be able to extract their sequences when several records are nested.
The statistics process is based on twin calls (begin/end events). The begin event specifies the start of the statistics measurement. The end event is executed to finalize the measurement (elapsed time for example), then all the information linked to the event is dumped into the disk in one line.
This sometimes makes it difficult to follow the chronological sequence of the logged statistics, particularly for nested events.
For example, if event scheduling is not set, typical output looks like this:
them=ERRORLOG:time=Wed Sep 17 16.06.14 2008:elps=0,00000:rtim=0,00000:cpus=0,00000:
        cmd=ErrorLogCmdAddin:msg="Hello..."
But if you do set event scheduling, the output includes 2 lines with respectively "bevt" and "eevt" tags and the same event number.
For example:
bevt=00000143:them=ERRORLOG:time= Wed Sep 17 16.06.14 2008:cmd=ErrorLogCmdAddineevt=00000143:them=ERRORLOG:elps=0,00000:rtim=0,00000:cpus=0,00000:msg="Hello..."This is useful when writing several different statistics to the same log, and you want to see the whole sequence of nested events logged and in chronological order.
For example:
bevt=0000001:them=NETWORK:time=Wed Mar 4 11.31.24 2009:level=0:ComSidl=NbRequest
bevt=0000002:them=NETWORK:time=Wed Mar 4 11.31.24 2009:level=0:ComSidl=RequestSize
eevt=0000002:them=NETWORK:elps=0.000:rtim=0.000:cpus=0.000:statsum=1332.0000
bevt=0000003:them=NETWORK:time=Wed Mar 4 11.31.24 2009:level=0:ComSidl=RequestNetSize
bevt=0000004:them=NETWORK:time=Wed Mar 4 11.31.24 2009:level=0:ComSidl=NbResponse
eevt=0000004:them=NETWORK:elps=0.000:rtim=0.000:cpus=0.000:statocc=4.0000
bevt=0000005:them=NETWORK:time=Wed Mar 4 11.31.24 2009:level=0:ComSidl=ResponseSize
eevt=0000001:them=NETWORK:elps=0.000:rtim=0.000:cpus=0.000:statocc=4.0000
eevt=0000003:them=NETWORK:elps=0.000:rtim=0.000:cpus=0.000:statsum=1332.0000
eevt=0000005:them=NETWORK:elps=0.000:rtim=0.000:cpus=0.000:statsum=3985374.0000
Activating Statistic thematics
You can activate one or more of the statistic thematics.
- In the Statistic Thematics section, select the
Activatecheck box. - Optional: To customize the output files, click More options for
each statistics category.
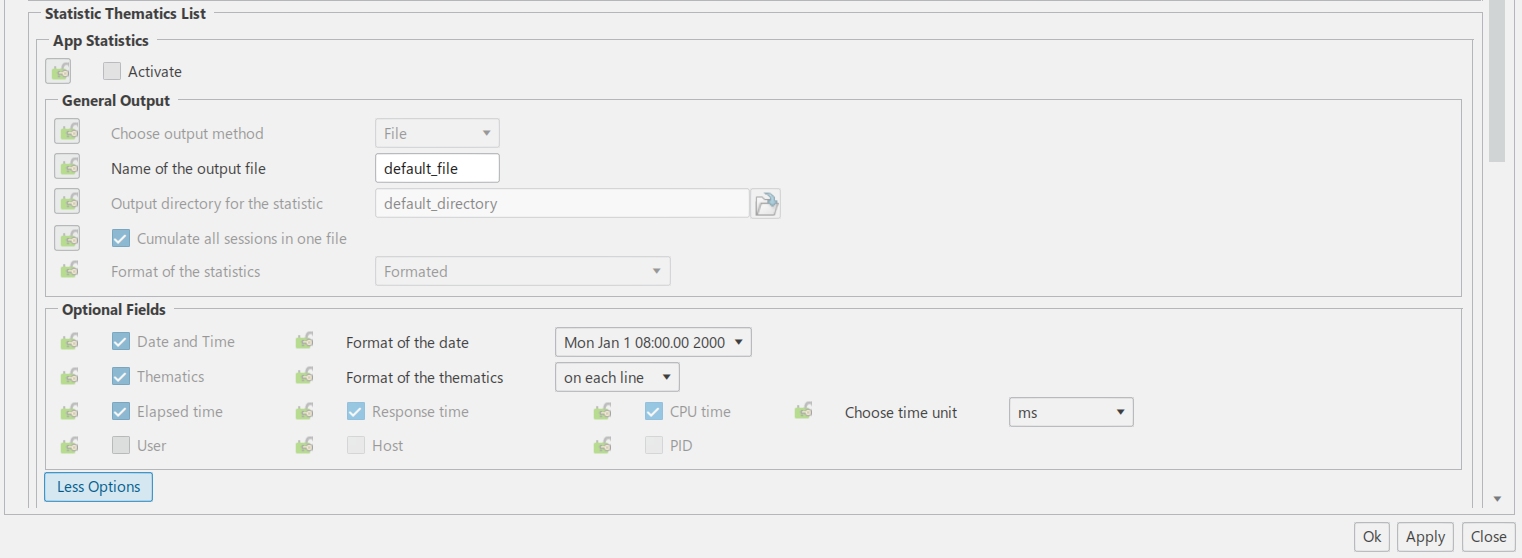
- General output
-
Specifies the output characteristics of the log file.
- Choose output media: only one possible value
- Name of the output: if you keep
default_file, the generated files will have a name composed of the thematic, the userid and the machine name (Stats_<thematic>_<Userid>_<Host>.log) - Output directory for the statistic: the default directory is set to (by
priority) ${CATErrorLog}, ${CATTemp},
or root drive. To change it, click

- Cumulate all sessions in one file: if checked, all the session logs related to the current thematic are recorded in the same file
- Format of the statistics:
- Formatted : uses CSV (Common Separated Value) format with the key
preceding each
value
them=COMMAND:time=Tue Dec 17 18.44.06
2019:elps=47:rtim=0:cpus=0:Command=CATMyGhostingHdr:NLS=Volatile
Ghosting:CurrentWorkbench=CATPcfPartWkb:NLS_CurrentWorkbench=Part
Design:Origin_Header=CATVisCommandsAddin:mode=BackgroundCmd:service=3DSpace:
tenant=on_premise:appname=E:\users\ur6\Workspaces\SDBSOAur6\LP5UR6DSY\win_b64\\code\bin\3DEXPERIENCE.exe
- Non formatted : uses CSV format without the
keys
COMMAND:Tue Dec 17 18.50.09 2019:32:0:0:CATMyGhostingHdr:Volatile
Ghosting:CATPcfPartWkb:Part Design:CATVisCommandsAddin:
BackgroundCmd:3DSpace:on_premise:E:\users\ur6\Workspaces\SDBSOAur6\LP5UR6DSY\win_b64\\code\bin\3DEXPERIENCE.exe
- Common Base Event : proprietary
format
<CommonBaseEvent creationTime="2019-17-12T18:45:42Z" extensionName="DS_STATS_COMMAND" globalInstanceId="DS-17976500820192" msg="Start" severity="0" version="1.0.1">
	<extendedDataElements name="time" type="string"> <values>2019-17-12T18:45:42Z</values></extendedDataElements>
	<extendedDataElements name="elps" type="string"> <values>31</values></extendedDataElements>
	<extendedDataElements name="rtim" type="string"> <values>0</values></extendedDataElements>
	<extendedDataElements name="cpus" type="string"> <values>0</values></extendedDataElements>
	<extendedDataElements name="Command" type="string"> <values>CATMyGhostingHdr</values></extendedDataElements>
	<extendedDataElements name="NLS" type="string"> <values>Volatile Ghosting</values></extendedDataElements>
	<extendedDataElements name="CurrentWorkbench" type="string"> <values>CATPcfPartWkb</values></extendedDataElements>
	<extendedDataElements name="NLS_CurrentWorkbench" type="string"> <values>Part Design</values></extendedDataElements>
	<extendedDataElements name="Origin_Header" type="string"> <values>CATVisCommandsAddin</values></extendedDataElements>
	<extendedDataElements name="mode" type="string"> <values>BackgroundCmd</values></extendedDataElements>
	<sourceComponentId component="E:\users\ur6\Workspaces\SDBSOAur6\LP5UR6DSY\win_b64\\code\bin\3DEXPERIENCE.exe" componentIdType="Application" location="LP5-UR6-DSY" locationType="Hostname" processId="20192" threadId="16852" componentType="COMMAND"/>
	<situation categoryName="ReportSituation">
		<situationType xmlns:xsi="http://www.w3.org/2001/XMLSchema-instance" xsi:type="ReportSituation" reasoningScope="INTERNAL" reportCategory="LOG"/>
	</situation>
</CommonBaseEvent>
- Windows Management Instrumentation : proprietary format

- Formatted : uses CSV (Common Separated Value) format with the key
preceding each
value
- Optional fields
-
This list contains all the statistics options common to all thematics that you can choose to display:
- Date and time: refers to the date and time of the beginning of the event
- Thematics: thematics name (you can choose to display them only on the first line or on each line).
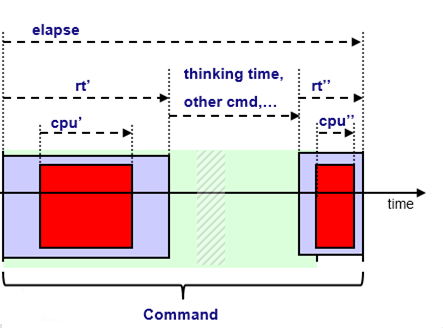
- Times (in ms or s):
- Elapsed time: real event duration
- Response time:
= elapsed time - thinking time - CPU: CPU usage duration
- User: user name
- Host: machine name
- PID: Process ID
Note: There can be additional options depending on the thematic. - Click Apply, then click Ok.
- The data is written in the statistics file with the following keys common to all thematics:
-
- them: thematic (command in this case)
- time: time
- elps: elapsed time spent in the command.
- rtim: "response time", which is the elapsed time minus user's thinking time.
- cpus: cpu time spent is the command.
- service: service name
- tenant: tenant name
- appname: application name
App Statistics
The app statistics theme reflects the time spent in the app.
Example of formatted traces for an app statistic log:
them=WORKBENCH:time=Wed Dec  4 13.12.16
        2019:elps=485:rtim=204:cpus=140:Workbench=CATPstProductWkb:NLS=Product Structure
        Design:service=3DSpace:tenant=on_premise:appname=3DExperience.exe
- Specific keys
-
- Workbench: internal workbench name
- NLS: human readable name of the workbench (the name that appears in the Start menu)
Commands Statistics
The Command Statistics thematic logs CATCommand usages.
Example of formatted traces for a command log:
them=COMMAND:time=Wed Dec  4 11.26.12
      2019:elps=0:rtim=0:cpus=0:Command=SelectWithArgHdr:NLS=:CurrentWorkbench=CATDrwDrwWkb:NLS_CurrentWorkbench=Drafting:Origin_Header=undef:mode=ForegroundCmd:service=3DSpace:tenant=on_premise:appname=3DExperience.exe
- Specific keys
-
- Command: internal command name
- NLS: external command name
- CurrentWorkbench: internal current workbench name
- NLS_CurrentWorkbench: external current workbench name
- Origin_Header: command headers are sometimes cloned, particularly global command headers each time a new window is opened. The origin header is the header from which the clones are built.
- mode: indicates whether the command being executed has the focus or not. Exclusive or Shared means that the command is in the foreground. Undefined means that the command is in the background.
This trace will be logged when you exit the command. The workbench name is the current workbench when you exit the command.
Certain auxiliary commands (for example, the Search command) are not logged.
Session statistics
The Session Statistics theme records information about application sessions (duration, start date, exit status).
This information is limited to one event per session. As such, it will help you keep track of users' session durations and ending status, providing a supplementary tool to measure MTBF.
No output is generated for the session during which the session statistics are activated. You have to exit then restart your session, and from then on you will obtain session statistics output for all further sessions.
Example of formatted traces for a session log:
them=SESSION:time=Fri Feb  8 17.15.58
        2019:user=UR6:host=LP5-UR6-DSY:upid=13736:elps=2719:rtim=2719:cpus=218:MainName=DSYAdmRegSrv:ExitStatus=normal_end:service=3DSpace:tenant=on_premise:appname=DSYAdmRegSrv
- Specific keys
-
- user: logged user name
- host: computer name
- upid: user ID
- MainName: application name
- ExitStatus: session exit status
Error statistics
The objective of this feature is to provide a key tool for MTBF tracking.
It will enable users to detect hidden problems or find areas where improvement should be done, in terms of quality and functionality. Not only failure will be logged but also defects which may cause any sort of problems to the end-user. Typically, it will log pop-up warnings, internal critical errors and failures.
Error Statistics Optional Fields contains the following three options specific to error logging:
- Workbench: displays the workbench
- Command: displays the command that contains the error
- Message: displays error message
Example of formatted traces for an error log:
them=ERRORLOG:time=Wed Dec 18 16.03.37
2019:wkb=CATPstProductWkb:cmd=CATMyGhostingHdr:cmdstart=Wed Dec 18 16.03.37
2019:elps=0:rtim=0:cpus=0:defect_class=Error:severity=error:msg="":nls="":Id=CKE_DELET
ED_FEATURE_PARAMETER_USE:Source=CATCkeParmFeatureSimple.cpp(377):Message=Use of deleted feature
parameter:service=3DSpace:tenant=on_premise:appname=E:\users\ur6\Workspaces\SDBSOAur6\LP5UR6DSY\win_b64\\code\bin\3DEXPERIENCE.exe
- Specific keys
-
- wkb: error workbench
- cmd: command containing error
- cmdstart: command starting time
- severity: severity level
- msg: error name
- nls: human readable error name
- Id: error ID
- Source: current source
- Message: human readable message associated to the error