-
Select the organizational resource in the tree.
-
From the Authoring section of the action bar, click Resource Balancing
 . .
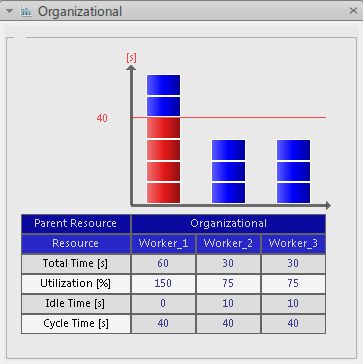
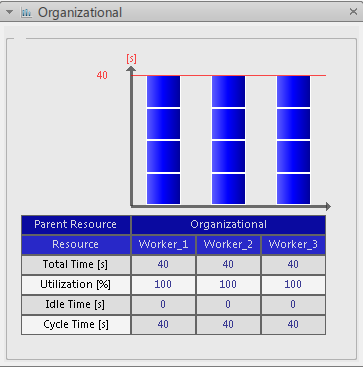
The Resource Balancing panel displays. This is the global panel showing
the operations assigned to all the working resources under the selected
organizational resource.
Useful information also displays in the table under the bar chart:
- Total time of the operations assigned to the working resource
- Percentage utilization of the working resource
- Idle time of the working resource
- Cycle time defined on the root system
The colored rectangles in the bar chart show the operations assigned to each
resource. By default, the operations are represented by blue rectangles.
Parallel operations (that is, operations that are done at the same time on a
given resource) are represented by red rectangles.
Notes:
- If you right-click the Parent Resource cell in the table, a
context menu displays for showing or hiding empty resource
columns in the bar chart. An empty resource column has no
assigned operations.
- Manage Resource Visibility:
provides a dialog box for showing or hiding any resource
column, whether it is empty or not.
- Show All Empty Resources: shows
all empty resources.
- Hide All Empty Resources: hides
all empty resources.
- Small Duration Mode: shows
operations with no defined duration.
- Actual Duration Mode: when the
operation rectangles are shown in Small
Duration Mode, this command switches to
the default mode.
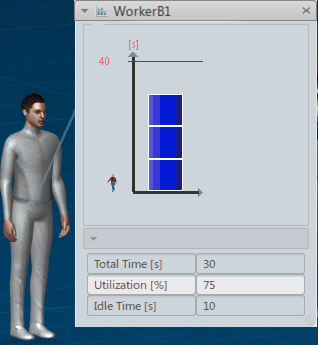
- You can select one or more working resources in the tree and
click Resource Balancing
 to display an individual panel for each resource. You can
show or hide the value list for a resource using the small arrow
button on the panel. The value list shows the total time,
utilization, and idle time for the resource. If several
individual panels are displayed, clicking the expander of any
panel hides or shows the value lists in all the panels. to display an individual panel for each resource. You can
show or hide the value list for a resource using the small arrow
button on the panel. The value list shows the total time,
utilization, and idle time for the resource. If several
individual panels are displayed, clicking the expander of any
panel hides or shows the value lists in all the panels.
- You can customize the colors of the rectangles in the bar chart
in
.
-
From the Authoring section of the action bar, click Resource Utilization Gantt
 . .
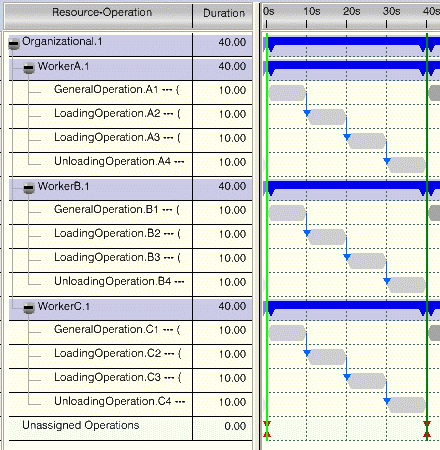
The Gantt chart shows that some of the operations are sequenced, others are not.
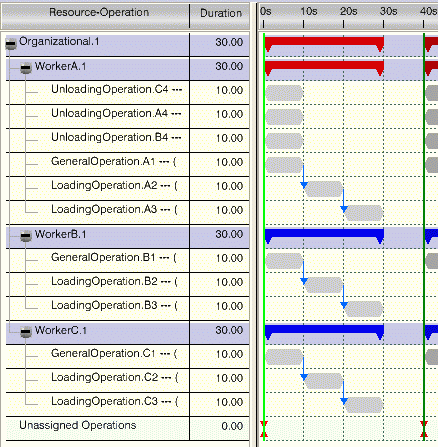
For WorkerA, there are four operations in parallel:
these are the operations that show up in red in the Resource
Balancing panel.
-
Drag an Unloading operation from WorkerA to WorkerB.
The operation is added to WorkerB. 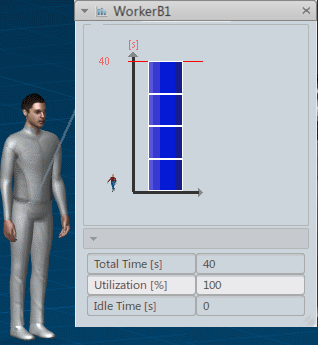
-
In the same way, drag another Unloading operation from WorkerA to WorkerC.
The operation is added to WorkerC. The Gantt chart is also updated to show that the
operations are now added to WorkerB and WorkerC. Notes:
- You can drag an operation:
- Between different individual bar charts
- Between the bar chart and the tree
- Between the bar chart and the 3D resource object
- Between columns of the bar chart to modify the assignment of
the operation.
- You can drag an operation from a working resource to a nonworking
resource and vice versa. In this case, the operation is assigned to
both resources and existing constraints are kept.
- You can drag an operation from one individual working resource panel
to another working resource panel to assign the operation to the new
working resource. If the operation was previously assigned to one or
more working resources:
- All those resources are unassigned and the operation is
assigned to the new working resource.
- If you press Ctrl during the drag,
the operation remains assigned to those resources in
addition to the new working resource.
-
Sequence the operations in the Gantt chart.
The bar chart and the information in the table are updated
accordingly (total time, utilization, and so on).
-
Select a rectangle representing an operation in the WorkerA column
of the bar chart.
The rectangle changes from dark blue to light blue and a
tooltip gives information about the operation. The operation is also
highlighted in the tree.
-
Right-click an operation.
A context menu displays, allowing you to create, edit, or delete time analyses, or
to modify operation properties.
-
Create a time analysis on the operation.
For more information, see the
Time-Motion Study
User's Guide.
-
Right-click the operation and select
Properties, then change
Time mode to
Analyzed time in the
Properties dialog box.
-
Right-click the
Total Time cell in the table.
A context menu displays, allowing you to change the time type
displayed on operations:
- Estimated Time
- Simulated Time
- Analyzed Time
- Time Type Defined On Operation
-
Select
Time Type Defined on Operation.
The bar chart is updated to show analyzed time on the
operation with the time analysis.
|


