Cycle State and Statistics | ||
| ||
Click Production System Simulation Options  , select the Monitoring Options tab, and select the Display Average Cycle Time check box.
You can view the:
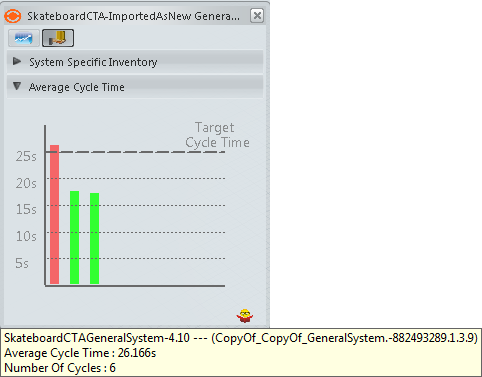
- Average Cycle Time of all the systems in the Systems Performance Monitor and Average Cycle Time of all the systems under an expanded system (in the system-specific chart ).
- Current Operations of a given cycle of each system during the simulation.
In the Systems Performance Monitor dialog box, you can view the Average Cycle Time tab . 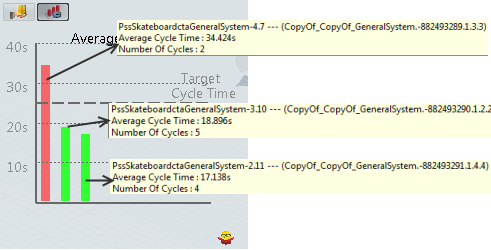
| Tip: The Average Cycle Time and Number of Cycles are displayed as Tool tip on the bar. |
The horizontal line in the Average Cycle Time is the Predefined Cycle Time, which is defined in the properties of the Root System or the Expanded General System. When the Average Cycle Time of an individual system is more than the Predefined Cycle Time, the Cycle Time Bar turns red.
The Average Cycle Time chart appears in the Statistics tab of the System Specific charts of the expanded system, which has the Average Cycle Time of all the systems.
The Operations chart in the Current State tab of the system-specific chart shows the operations of the current cycle. The time of failure and the operation time is accounted for in the cycle time.
For scenario results display, the Average Cycle Time chart displays in the Systems tab of Global Statistics chart.
Select the HTML Report  , the HTML report of Systems Performance Monitor and the System Specific Charts of the expanded system has the statistical details of the Cycle Time of each system.