System States during Simulation | |||||
|
| ||||
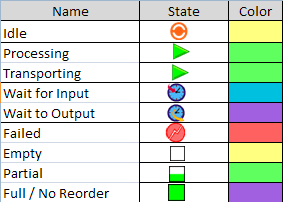
In state time charts, the corresponding color
code is used to show the time spent by the system in that
state. The colors that appear during the simulation has significance, and displays a system state. The following image shows the set of colors used for displaying different system states during simulation.
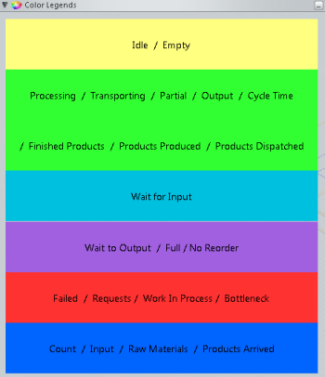
Color Legend displays are used in charts, you can enable color legends in Process Flow Simulation options dialog box. It shows the state time colors and the bar charts colors.
To view the Color Legend option:
- Check Show Color Legends option to display the legend during simulation. The chart displays in the same location where previously it was closed. When the dialog is minimized the dialog will be docked to System Editor.
- Enable Display Color Legends Charts display in the Simulation Monitoring Options panel.
- Start the simulation. The Color Legends
 panel appear. You can move the Color Legend position to different position.
 - To remove Color Legend, clear the Color
legends charts display option in the Monitoring Options
dialog box.
The chart does not appear.
Note: If you enable Color Legends charts, the chart displays in the same location where it was closed previously.
