Product Inventory State and Statistics | |||||
|
| ||||
You can view the:
- current state of the Overall Product Inventory and System Specific Inventory Chart of all the system under Root System in the Product Inventory tab of the System Performance Monitor dialog box.
- current state of the Overall Product Inventory and System Specific Inventory Chart all the system under the Expanded General System in the Current State tab of the System Specific Charts of the Expanded general system.
- Average Inventory Chart in the Statistics tab of the System Specific Charts of the expanded general system.
The Product Inventory tab of the Global Chart dialog has two expanders:
- Current State Overall Product Inventory chart .
- Current state System Specific Inventory chart.
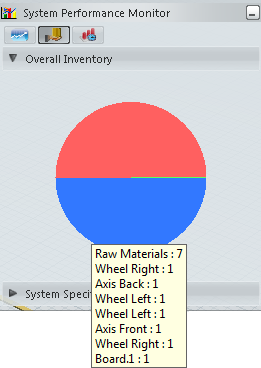
In all the Product Inventory Charts; the Raw Material appears as Blue, the Work-In-Process as Red, and the Finished Products as Green.
- Raw Material: are the products which are coming out of the source into the model.
- Work-In-Process: are the set of unfinished products which has undergone at least one Transformation.
- Finished Products: are products that have undergone final transformation and is ready to be dispatched out of the System.
- Overall Product Inventory Chart is a Pie Chart which displays the Current State percentage of the products that belongs to RAW Material, Work-In-Process, and Finished Product.
The system specific inventory chart is a bar chart which displays the number of products present in any system under the Root System. Tool Tip on the bar lists the products in the system at the time of simulation. 
The Average Inventory chart is a Bar Chart which displays the time weighted average number of products on all the systems under the Expanded General System .

The Tool Tip of the Average Inventory Chart on any system specific bar gives the average with respect to time of RAW, WIP, FIN product present in that System.
In the Scenario Results Display, the Systems tab of the Global Statistics Report dialog box has the System Utilization chart, Average Cycle Time and System Specific Average Inventory Chart as the following figure: 
In the Scenario Results Display, the System Specific Charts of the expanded general system has Product Inventory chart with the average inventory of all the system under the expanded general system.
Select the  HTML Report of System Performance Monitor and the System Specific charts of the Expanded General system for the statistical details of the Product Inventory of each system.