| Business Objects |
From Project Management:
- Person
- Member relationship
- Task allocation
- Task start date
- Task end date
|
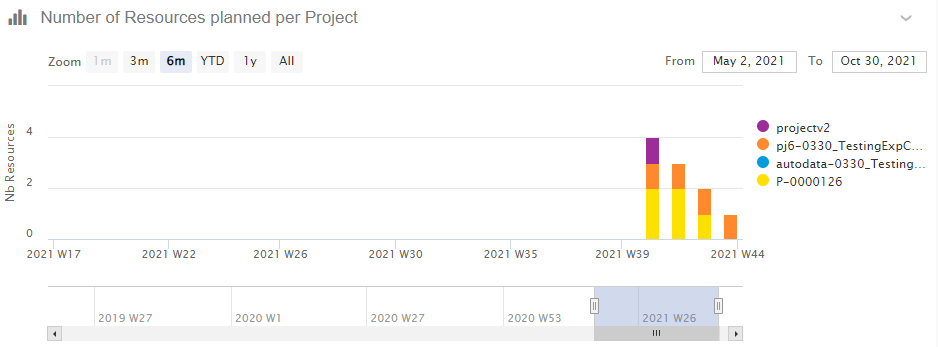
| Values (or x-axis and y-axis) |
- X-axis: Weeks.
- Y-axis: Total number of assignees to tasks that are not in the complete state
per project.
For example, for a given day, assume a project with 3 tasks (Task
#1, Task #2, Task #3): Task #1 has 2 assignees: Assignee A and Assignee
B. Total of assignees for Task #1: 2 Task #2 has 3 assignees,
Assignee A, Assignee B, and Assignee C. Assignee A and Assignee B are
ignored because they were already taken into account with Task #1. Total
of assignees for Task #2: 1. Task #3 has 4 assignees but the task is in
the complete state. Total of assignees for Task #3: 0. For this
project on this given day, the total number of assignees to tasks that are not
in the complete state is 2 + 1 + 0 = 3.
|
| Sorting |
Chronologically, oldest to newest from left to right. |
| Limits |
No limits. |
| Colors |
One color per project. |
| Available Views |
Bar chart. |
| Interactions |
On this chart, you
can:
- Paginate through all chart entries by using the pagination.
- Increase the chart size by clicking .
|
| Technical Details |
— |
 Maximize