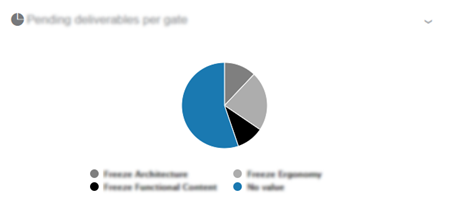
Pending Deliverables Per Gate | ||
| ||

| Business Objects | Deliverables (any Business Object linked to a Task via the Task Deliverable connection) from Project Management. |
| Values (or x-axis and y-axis) |
|
| Limits | No limits. |
| Available Views | Pie chart |
| Interactions | On this chart, you can:
|
| Technical Details | — |