Risk Probability Vs Impact | ||
| ||
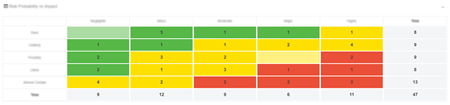
| Business Objects | Risks from Project Management. |
| Values (or x-axis and y-axis) |
|
| Sorting |
|
| Limits | No limits. |
| Available Views | Matrix |
| Interactions | On this chart, you can:
|
| Technical Details | — |
 See underlying data
 Maximize