| Business Objects |
Risks from Project Management. |
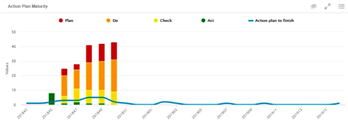
| Values (or x-axis and y-axis) |
- X-axis: Weeks.
- Y-axis:
- Stacked bars: Total number of open tasks broken down by state.
- Blue line: Number of new tasks.
|
| Sorting |
Chronologically, oldest to newest from left to right. |
| Limits |
No limits. |
| Colors |
One color per task state. |
| Available Views |
Combo chart: Stacked bar chart and line chart. |
| Interactions |
On this chart, you can:
- Paginate through all chart entries by using the pagination.
- Show underlying data by clicking .
- Increase the chart size by clicking .
|
| Technical Details |
— |
 See underlying data
 Maximize