What's New | ||
| ||
R2022x FD01 (FP.2205)
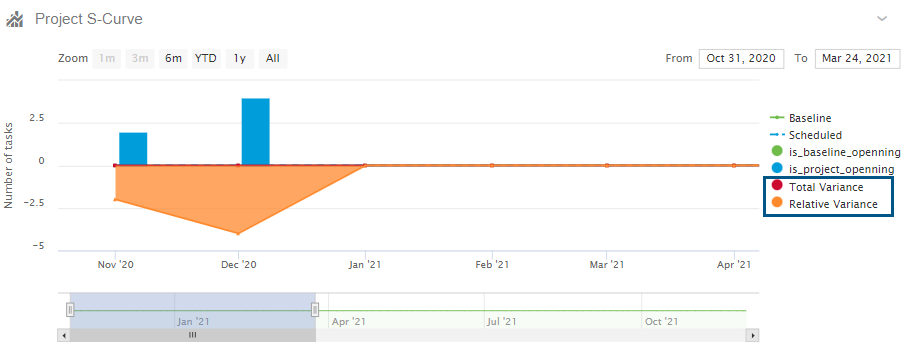
- Total Variance and Relative Variance are now computed when displaying a project chart (S-curve).
- Risk description has been added to the Mitigation tasks table.
- Realized effort has been added to the graph displaying planned effort.
- When in a Gantt chart, passive links (corresponding to passive tasks) are now displayed when clicking "Show all links between nodes".
- Icons are now displayed next to assessment statuses in the Details pane.
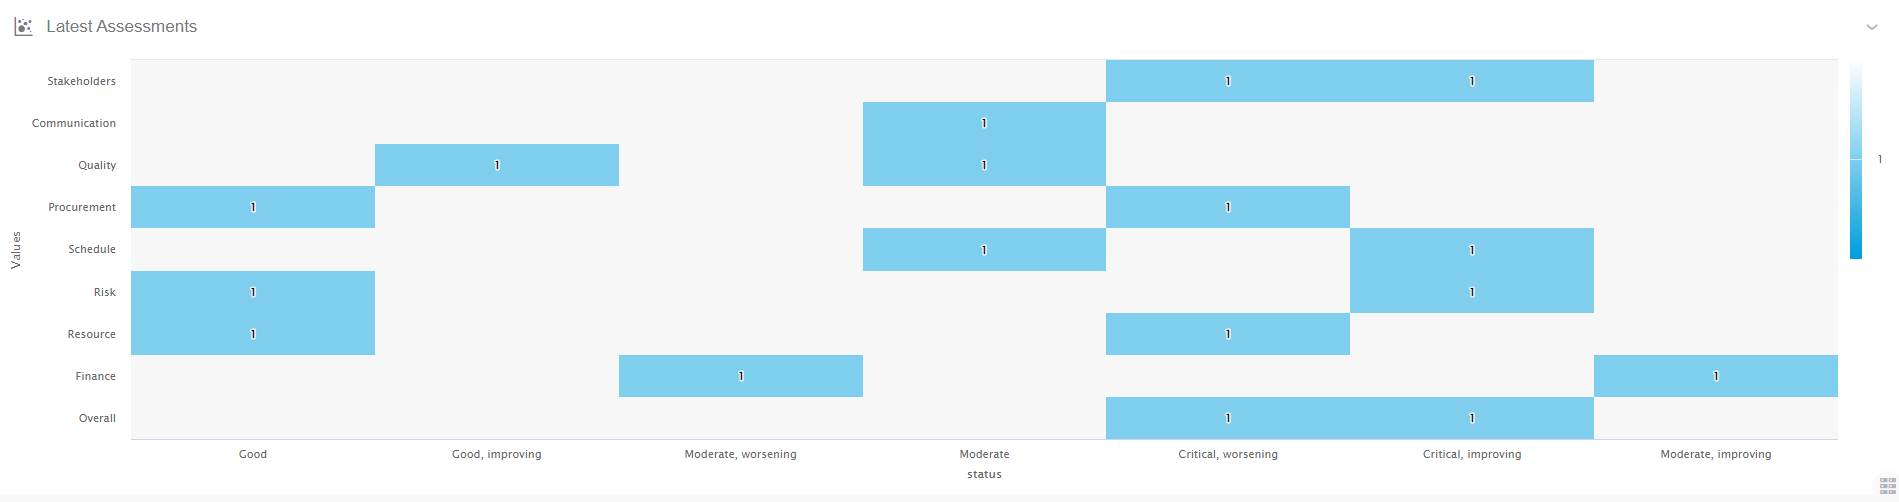
- Assessments types are now broken down in different tabs and graphs.
- Line charts represent statuses over time and a heat map displays a view of
assessment types and statuses.
- The graph displaying the pipeline view of projects by phase has been improved.

Variance Calculation in S-Curve
Benefits: Enrich graph.
Risk Description - Mitigation tasks
Benefits: Enrich table.
Planned and Realized Effort Graph
Benefits: Enrich graph.
Passive Links Displayed in Gantt Charts
Benefits: Enrich graph.
Icons for Assessments
Benefits: Clearer view on statuses.
New Graphs for Assessments
Benefits: Meaningful graphs.
New Graph for Pipeline View
Benefits: Ease analysis.