Using the Graph View

This page provides information on how to use the graph that appears on the Graph View tab of the Details pane.

This task shows you how to:


Before you begin: When available, click and go to the Graph View tab.
Note: This option is available on most See Underlying Data panes and on some tables across the app.

Understand the Graph

This graph shows the following elements:

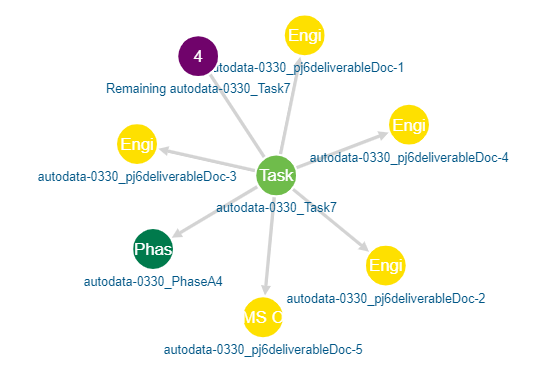
  • A central node, which shows the object whose details you are currently viewing.
  • Peripheral nodes, which show the related objects of the central node object.
    Note: These related objects also appear on the Related Objects tab of the Details pane.
  • An arrow between nodes, indicating that the objects are related.
    Note: Arrows always point toward the peripheral nodes, regardless of the objects' relation direction.
  • A pagination node (in purple), when an object has more than 10 related objects.

Zoom in and out on the Graph

Scroll with your mouse to zoom in and out on the graph.

Move a Node

Click the node you want to move and drag it to the area you want it to be.

Display More Nodes

By default, the graph only displays the first 10 related objects. The number of related objects is indicated in a purple node.

Click the pagintion node and select Expand.
You can repeat this step until all nodes are displayed.

Display Another Object in the Central Node

You can change the object that the central node displays.

Click the peripheral node of the object you want to display in the central node and select See Details.

This object now appears in the central node.

Filter Objects

You can filter the objects displayed in nodes in the Graph view.

  1. From the top right-hand corner of the widget, click .
  2. Unselect the objects that you want to hide from the graph.
    The Graph view is updated accordingly.