Simulation Equations | ||||
|
| |||
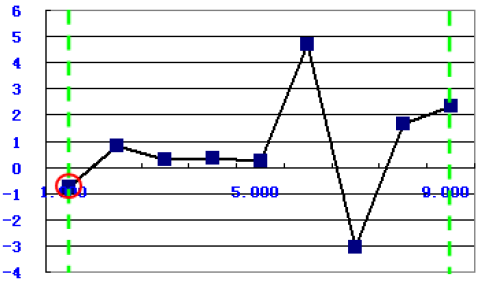
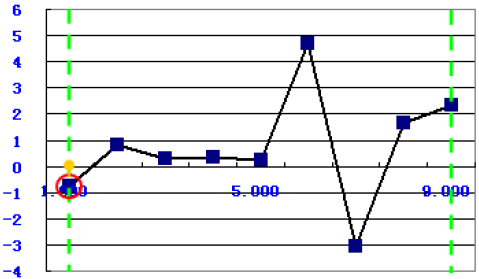
Start Position
The function uses the following equation:
to calculate the x start value of the simulation data in the range of Yi (marked in red) between the two green borderlines, as shown in the following graph:
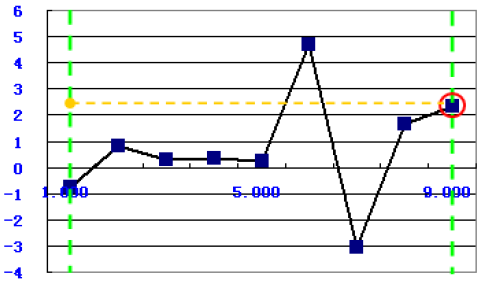
End Position
The function uses the following equation:
to calculate the x end value of the simulation data in the range of Yi (marked in red) between the two green borderlines, as shown in the following graph:
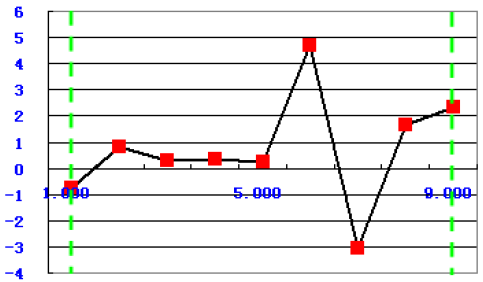
Number of Data Points
The function uses the following equation:
to calculate the number of the data points (marked in red) between the two green borderlines. In the following example, the result is 9.
Minimum X Value
The function uses the following equation:
to calculate the minimum value of the x-axis between the two green borderlines, as shown in the following graph:
Maximum X Value
The function uses the following equation:
to calculate the maximum value of the x-axis between the two green borderlines, as shown in the following graph:
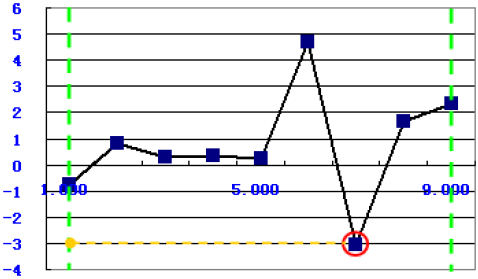
Minimum Y Value
The function uses the following equation:
to calculate the minimum value of the y-axis between the two green borderlines, as shown in the following graph:
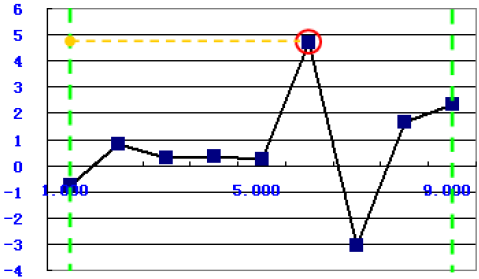
Maximum Y Value
The function uses the following equation:
to calculate the maximum value of the y-axis between the two green borderlines, as shown in the following graph:
Position of Minimum Y Value
The function uses the following equation:
to calculate the minimum value's position of the y-axis between the two green borderlines, as shown in the following graph:

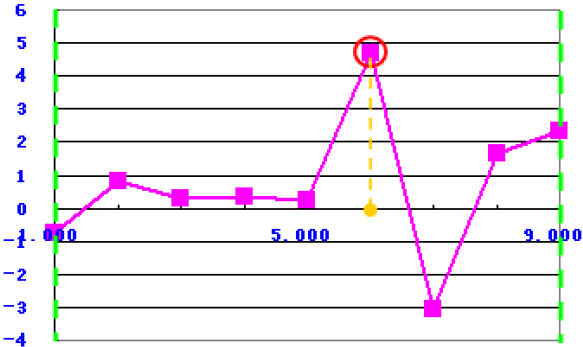
Position of Maximum Y Value
The function uses the following equation:
to calculate the maximum value's portion of the y-axis between the two green borderlines, as shown in the following graph:
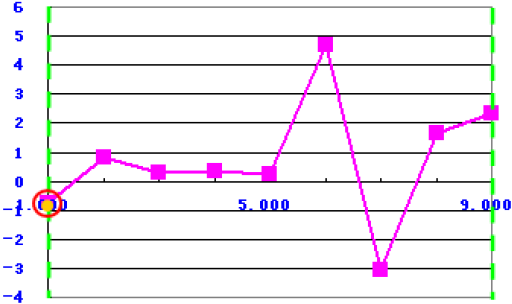
Y Value of Minimum X Value
The function uses the following equation:
to calculate the y value of the minimum position target x between the two green borderlines, as shown in the following graph:
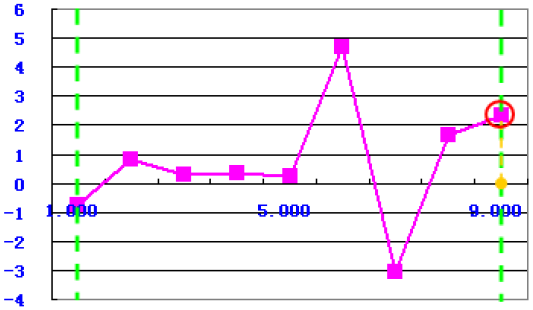
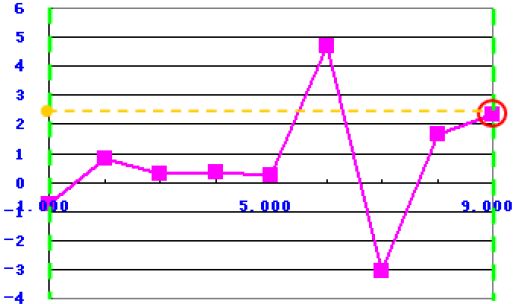
Y Value of Maximum X Value
The function uses the following equation:
to calculate the y value of the maximum position x between the two green borderlines, as shown in the following graph:
Mean
The function uses the following equation:
to calculate the mean value of the y-axis.
Sigma
The function uses the following equation:
to calculate the sigma of the y-axis.
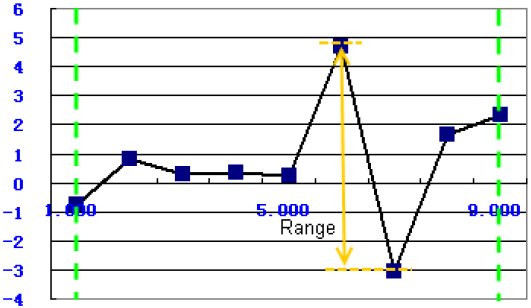
Range
The function uses the following equation:
to calculate the range of the y-axis between the two green borderlines, as shown in the following graph:
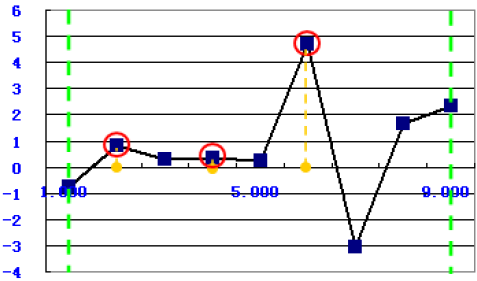
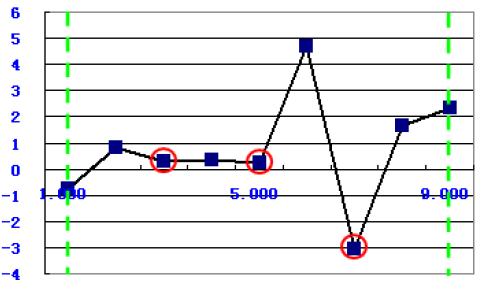
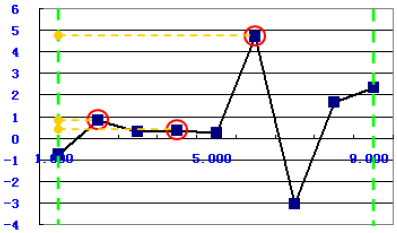
Number of Troughs
The function uses the following equation:
to calculate the number of the trough points (marked in red) between the two green borderlines. In the following example, the result is 3.
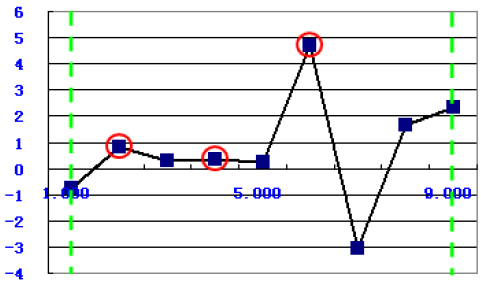
Number of Peaks
The function uses the following equation:
to calculate the number of the peak points, marked in red, between the two green borderlines. In the following example, the result is 3.
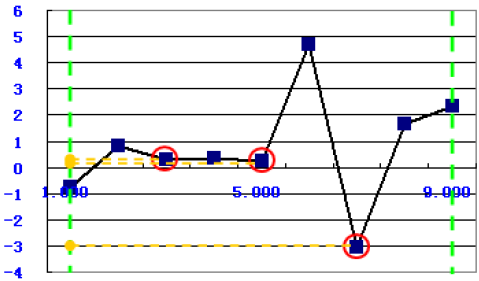
Trough Values
The function uses the following equation:
to calculate the values of the trough points between the two green borderlines as an array, as shown in the following graph:
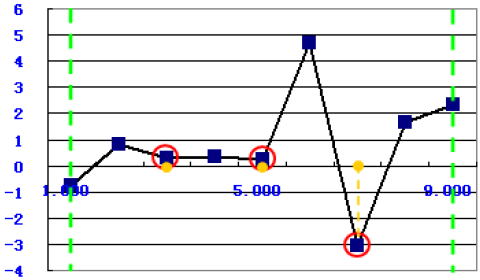
Trough Positions
The function uses the following equation:
to calculate the positions of the trough points between the two green borderlines as an array, as shown in the following graph:
Peak Values
The function uses the following equation:
to calculate the values of the peak points between the two green borderlines as an array, as shown in the following graph:
Peak Positions
The function uses the following equation:
to calculate the values of the trough points between the two green borderlines as an array: