Correlation Factor
The function uses the following equation:
to calculate the correlation coefficient between the simulation data and the target data.
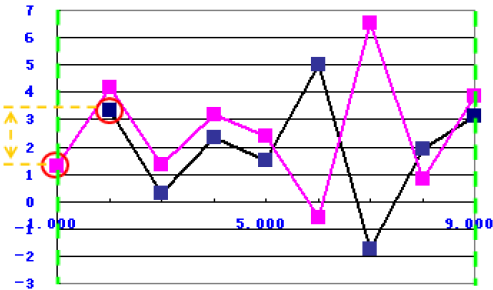
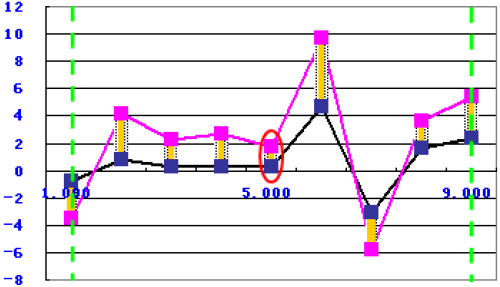
Difference of Maximum Position
The function uses the following equation:
to calculate the difference of the maximum x value between the simulation data and the target data within the two green borderlines, as shown in the following graph:
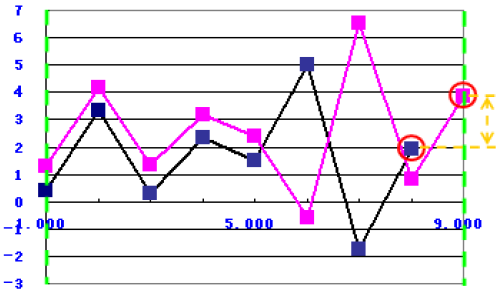
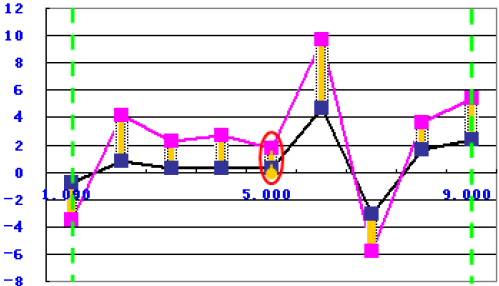
Difference of Minimum Position
The function uses the following equation:
to calculate the difference of the minimum x value between the simulation data and the target data within the two green borderlines, as shown in the following graph:
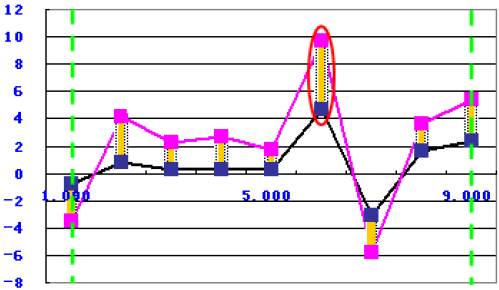
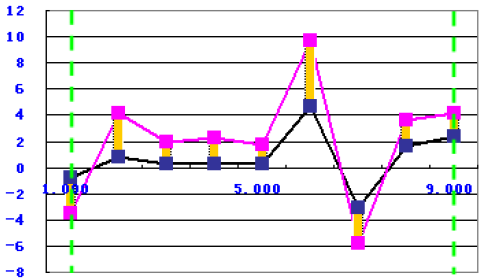
Maximum Difference
The function uses the following equation:
to calculate the maximum value of the absolute value of difference between the simulation data and the target data within the two green borderlines, as shown in the following graph:
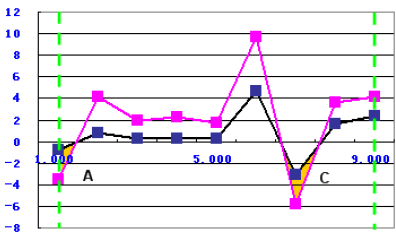
Maximum Difference Position
The function uses the following equation:
to calculate the maximum value's position of the absolute value of difference between the simulation data and the target data within the two green borderlines, as shown in the following graph:

Minimum Difference
The function uses the following equation:
to calculate the minimum value of the absolute value of the difference between the simulation data and the target data within the two green borderlines, as shown in the following graph:
Minimum Difference Position
The function uses the following equation:
to calculate the minimum value's position of the absolute value of difference between the simulation data and the target data within the two green borderlines, as shown in the following graph:
Russell Comprehensive Error Factor
The comprehensive error factor is formed by the combination of magnitude and phase error factors using the following equation:
Russell Magnitude Error Factor
The sign of the magnitude error factor indicates which response is larger in magnitude, and is not biased toward either set of data. The magnitude error magnitude is independent of any phasing between two data, in terms of relative orders of magnitude, and is independent of any phasing between the simulation data and the target data. The following equation is used:
Russell Phase Error Factor
The phase error factor is a direct measure of the temporal correlation between the simulation data and the target data and is independent of the magnitudes. A specific interpretation of the phase error factor is that it is the phase angle between the two data. The phase error is, by definition, bounded between 0.0 and 1.0. The following equation is used:
Standard Deviation of the Difference
The function uses the following equation:
to calculate the deviation between the simulation data and the target data.
Sum of the Absolute Difference
The function uses the following equation:
to calculate the absolute value of the sum of the difference between the target data and the simulation data within the two green borderlines, as shown in the following graph:
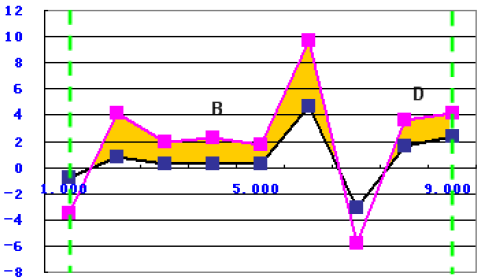
Sum of the Area Difference Over the Target
The function uses the following equation:
to calculate the sum of the area between two curves's graphs where the simulation data exceeds the target data within the two green borderlines, as shown in the following graph:
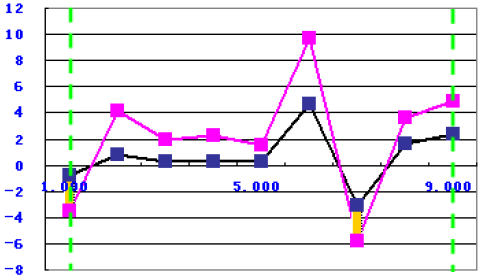
Sum of the Area Difference Under the Target
The function uses the following equation:
to calculate the sum of the area between two curves' graphs where the simulation data is below the target data within the two green borderlines, as shown in the following graph:
Sum of the Difference Mean
The function uses the following equation:
to calculate the mean value of difference between the simulation data and the target data.
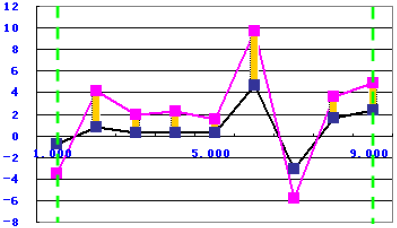
Sum of the Difference Over the Target
The function uses the following equation:
to calculate the sum of the difference of the value where the simulation data exceeds the target data between the two green borderlines, as shown in the following graph:
Sum of the Difference Under the Target
The function uses the following equation:
to calculate the sum of the difference of the value that the simulation data is below the target data between the two green borderlines, as shown in the following graph:
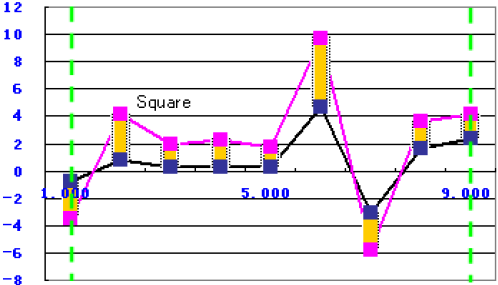
Sum of the Squared Difference
The function uses the following equation:
to calculate the squared sum of the difference between the simulation data and the target data within the two green borderlines, as shown in the following graph:
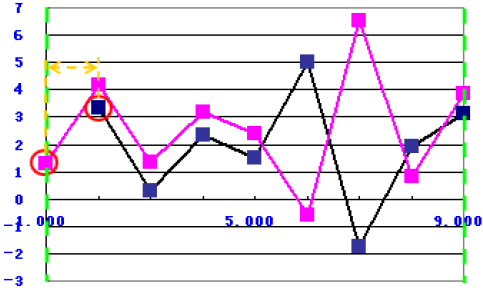
Y Value Difference of Maximum Position
The function uses the following equation:
to calculate the difference of the y value at the maximum x position between the simulation data and the target data within the two green borderlines, as shown in the following graph:
Y Value Difference of Minimum Position
The function uses the following equation:
to calculate the difference of the y value at the minimum x position between the simulation data and the target data within the two green borderlines, as shown in the following graph: