Modify the Chart Options
You can modify the background and the title of a chart.
-
Right-click the chart you want to modify, and select
Options.
If the chart you want to work in is the active one, you can
also, from the Plot toolbar, click
Options
 . .
The
Options dialog box appears.
-
Select the item
Chart.
-
Modify the background options.
- To display a background, select the
Show fill check box and select a color.
- To display chart borders, select the
Show border check box; and modify the
color, the thickness, and the type.
-
To add a chart title, in the
Title text box, type the title, and select a
color and a font.
This option is useful when the plot contains several charts.
-
To confirm the modifications and close the dialog box, click OK.
Modify the Grid Options
You can modify the grid options of a chart.
-
Right-click the chart you want to modify, and select
Options.
If the chart you want to work in is the active one, you can
also, from the Plot toolbar, click
Options
 . .
The
Options dialog box appears.
-
Select the item
Grid.
-
Modify the options of the grid area.
- To modify the color of the background fill, select the
Show fill check box, and select a color in
the list.
- To remove the background color, clear the
Show fill check box.
- To modify the border of the grid, select the
Show border check box; and modify the
color, the thickness, and the line type.
- To remove the border of the grid, clear the
Show border check box.
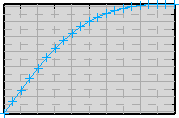
Example of a grid with a default background color and a
default border:

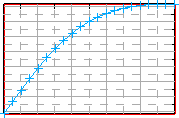
Example of a grid with no fill and a border colored in red:

-
Modify the grid options of the abscissa and the ordinates.
- To modify the major lines of the grid, select the
Show major check box; and modify the
color, the thickness, and the line type.
- To remove the major lines from the grid, clear the
Show major check box.
- To modify the minor lines of the grid, select the
Show minor check box; and modify the
color, the thickness, and the line type.
- To remove the minor lines from the grid, clear the
Show minor check box.
Example of a grid in which the major lines of abscissa
and the minor lines of ordinates are hidden, the minor lines of the abscissa
are colored red, and the major lines of the ordinates are displayed with the
default options:

-
To confirm the modifications and close the dialog box, click OK.
Modify the Legend Options
You can modify the legend of a chart.
-
Right-click the chart you want to modify, and select
Options.
If the chart you want to work in is the active one, you can
also, from the Plot toolbar, click
Options
 . .
The
Options dialog box appears.
-
Select the item
Legend.
-
By default, a legend is associated with the chart.
- To remove the legend from the chart, clear the
Show legend check box.
- To add a legend to the chart, select the
Show legend check box.
-
Modify the position of the chart legend.
- In the
Placement list, select
Outside to display the legend outside the
chart or
Inside to display the legend inside the
chart.
- To change the position of the chart legend, select one of
the
Position options:
Left,
Bottom left,
Bottom,
Bottom right,
Top left,
Top,
Top right, or
Right.
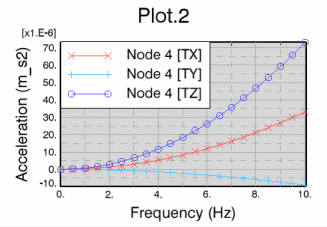
Example of a chart with a legend inside the chart and at
the top left position of the chart:

-
Modify the title options of the chart legend.
- To add a title to the chart legend, enter a title in the
Legend title box; and modify the color and
the font of the text.
- To remove the title of the chart legend, clear the
Legend title box.
Example of a chart legend without a title:

Example of a chart legend with a title (Chart
Legend):

-
Modify the border options of the chart legend.
- To modify the border of a chart legend, select the
Show border check box; and modify the
color, the thickness, and the line type.
- To remove the border of a chart legend, clear the
Show border check box.
Example of a chart legend with border modifications:

-
Modify the background of the chart legend.
- To modify the background color of a chart legend, select
the
Show background check box, and select a
color in the list.
- To remove the background color of a chart legend, clear the
Show background check box.
Example of a chart legend with a gray background:

-
To confirm the modifications and close the dialog box, click OK.
|
 .
The Options dialog box appears.


