-
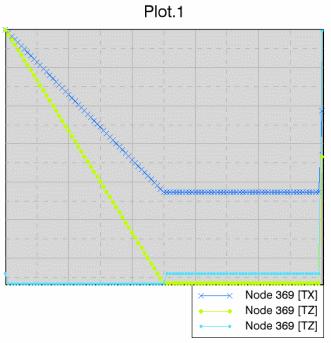
Right-click anywhere in the chart, and select
.
All axes are hidden to indicate that you are in the active axis mode.  -
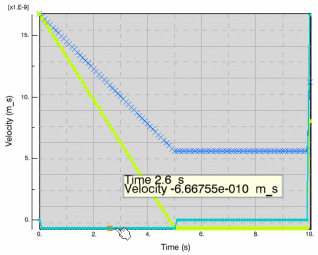
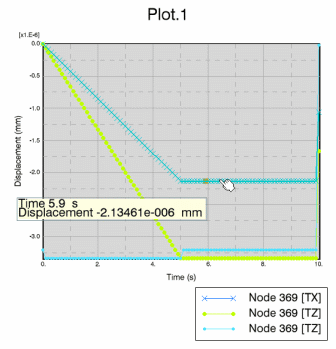
Select a curve or pass your cursor over a curve.
Only axes associated with the selected curve are shown and axes of all other curves
are hidden.   -
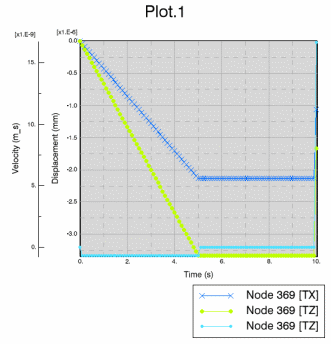
To exit the active axis mode, right-click the chart, and select again.
All axes are shown. 
|