Configure Business Information (Optional)
You can import business information to review the different indicators related to the products, and define the position coefficient in a gondola.
Before you begin: You may need to retrieve business information from an external server. Your Business Administrator can retrieve the information from an external server.
- In the Merchandising menu, click Indicators
 . .Note:
By default the Configuration section is selected. You can use the Configuration section to import data and to define position coefficients.
The Import Data panel in the Configuration section has the following subsections: - If data are already imported, the Current Data section displays the imported information.
- If no data are previously imported, the Current Data section is unavailable. You have to import data from the Import New Data section.
- In the Import New Data section, select either of the following sources:
- Server: To import business information from a server.
- Excel file: To import business information from an Excel file.
By default, the Server source is selected. Your Business Administrator can configure the default selection. - If the source is Server, select the following options:
- Start and End: To import business information of a specific period.
- Stores Group (mandatory): To import business information corresponding to sales history in this group of stores.
Note:
If you define a retail category, the stores group list is computed from the retail category data. If you use an object (gondolas, scenes...) not associated with a retail category, you need to retrieve the StoresGroupDescription file from the server. This .xml file describes the stores groups.
- Planograms associated to a retail store: If the document is an adaptation, you can select the associated retail store. In this case, the data is imported based on the Business ID of the retail store. If there are compositions along with adaptations in the plan list, you can select a store group list.
- Optional:
Use Substitute UPC: To specify a substitute UPC for new products without sales history in ENOVIA.
This substitute UPC usually corresponds to a product for which the sales history is available. Select Use Substitute UPC to import (when available) business information of the substitute product instead of the product itself. Note:
If a product has no substitute UPC when you select this option, business information of the default product is imported.
- If the source is Excel file, click Browse to select the file.
The following formats are supported: .xls, .xlsx, and .xlsm. - Click Import Data.
Business information is imported. Current information is overwritten whenever you import new business information. - In the Position Coefficients panel in the Configuration section, select either of the following:
Display Business Indicators
You can display business indicators once data is imported.
- From the Indicators tab, select the Indicators section.
- In the Display Type section, select a type:
- Products: To display the business indicators of products.
- Document: To display the business indicators of the current edited document.
- Elements: To display the business indicators of gondola sections, pallets, and furniture.
- Segmentation Node: To display the business indicators of segmentation nodes.
The Level option becomes available. Select a level of a segmentation node. Note:
Level 1 corresponds to the nodes located at the top of the segmentation. Level 2 corresponds to the nodes located on the second line of the segmentation. If a gondola is not related to a sub assortment, there is no consumer decision tree. Consequently, the Segmentation Node option is not available.
- Attributes: To display the business indicators of products attributes.
The Attribute option becomes available. Select an attribute to display. A legend table also appears. If required, click a row in the table to highlight the group attributes in 3D area. To sort the table, click the arrow in a header column. Note:
Your Business Administrator can configure business information to display these attributes.
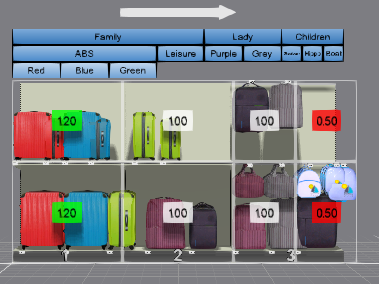
- In the Indicators section, select the indicators to display.
Note:
You can only check three indicators at a time.
- Check the Linear Meters and Stock Shelves boxes.
- In the Settings section, select an indicator in the Indicator Selection list.
- In the Display section, select and modify the options of the indicator:
- Color: To modify the indicator's background color.
Note:
By default, the background color is white.
- Text color: To modify the indicator's text color.
Note:
By default, the text color is black.
- Number of decimals: To modify the indicator's number of decimals.
Note:
By default, the number of decimals is 2.
- Currency Position: To modify the position of the currency (Middle, Left or Right).
Note:
This option is only available if a currency is displayed.
- Display: To modify the indicator's value (Raw or Percentage).
Note:
The percentage value corresponds to the ratio of a raw value compared to the whole document.
Your Business Administrator can configure weighted indicators using which business indicators are computed. - Type: To modify the data type (Number or Text).
- In the Group section, select the computation of a group:
- Formula: To define how the indicator is grouped. If you select Number in the Type field, Sum, Average, Minimum, Maximum, Defined values count, and None are listed. If you select Text in the Type field, Most and None are listed.
- Weighting: To define the weighting of indicators for groups (None or Product Quantity). This option is available only if you select Number in the Type field.
Notes:
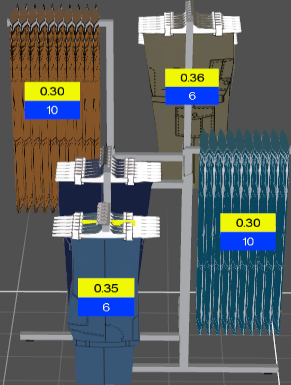
The following conditions are applicable when you opt to compute the value for a group.- When multiple products are displayed on a peg, only one business data is displayed to avoid cluttering. Business information with numerical data is displayed based on the group formula. For non-numerical string data, the business information of the product with most occurrences is displayed. If two products with same number of occurrences are on a peg, the business information of the product facing the customer is displayed.
- Your Business Administrator can configure the default options of indicators. Configured options are persistent when opening a model.
To restore these default options, click Restore Default.
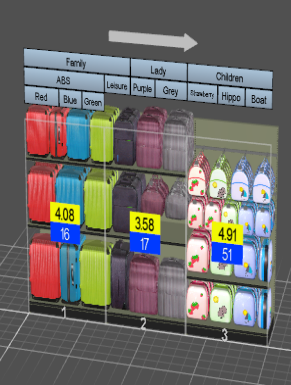
Analyze Indicators
You can analyze indicators. The analysis of indicators is only available for products' data.
- From the Indicators tab, select the Analysis section.
Note:
This section improves the 3D planogram by highlighting all the products that are marginalized in the current 3D model. In this particular case, if the indicator is Linear Meters, the products are highlighted if they represent the lowest or highest percentage on the Linear Meters range, and appear in bright colors.
- Select the indicator to analyze in the Indicators Selection list.
- Enter the values that correspond to the thresholds of the indicator.
- Associate a color with each threshold.
Note:
Your Business Administrator can configure the default analysis colors.
- Click Display to highlight the products.
 Colors are applied to the products. When you select a product, business information appears in the status bar. - Optional: In the Opacity section, drag the slider to adjust the color opacity. By default, the opacity is defined as 75.
Display Content
You can display content of an object included in another object without editing in context. Content includes business information, annotations, segmentation.
- Click an object (for example a gondola).
A menu appears. Note:
This menu is available with the following objects: gondolas, stores, scenes.
- Click one of the following commands:
Display Business Performance Reports
You can display business performance reports. Required access role: Author
- In the Merchandising menu, click Indicators.
The Reporting panel appears. - Click a tab to display a report.
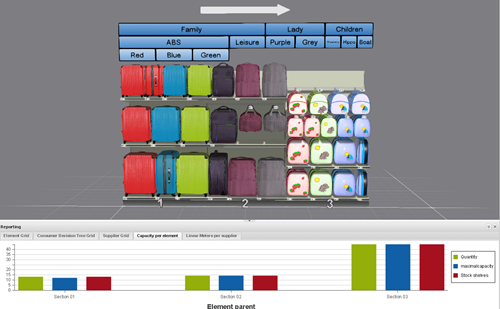
Note:
Your Business Administrator can configure these reports.
|


 the business information panel.
 or hide
  a gondola segmentation.
 : To edit in context.
 or hide
  annotations.