About Obscuration Plots | |
| |
An obscuration plot provides a quick estimate of antenna coverage without running a detailed electromagnetic simulation. Antenna Placement first computes a one-time tessellation of the platform, then computes the coverage estimate using an inexpensive ray-casting algorithm. If there are regions that are not of interest to your analysis, you can limit the coverage calculation to a specific range in spherical coordinates. Narrowing the range improves the resolution of the coverage calculation by focusing the rays over a smaller area.
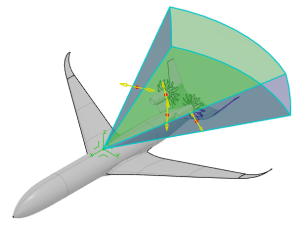
The image below shows an example of an obscuration plot's range for an aircraft assembly. You can interactively modify the range, shown by the green and blue region, using the yellow handles. The placement candidate is located at the vertex of the range. Therefore, the range selection limits the obscuration plot to display only the blockage area caused by the rear tail of the aircraft.

The blockage area is the percentage of the plot's area that the platform obscures. For the example above, the blockage area is 36%. This percentage represents the amount of blue area in the obscuration plot, as shown below. Generally, a lower blockage area results in better antenna performance when you run a detailed electromagnetic simulation with CST Studio Suite.
