About Radiation Patterns | |
| |
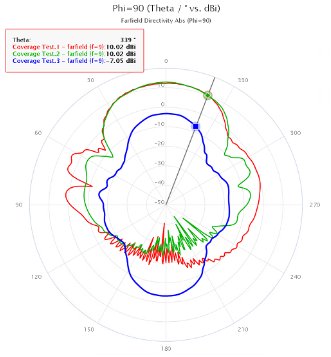
Antenna Placement provides the radiation pattern results as far-field directivity curves on a polar plot for each predefined section plane. When you display the radiation patterns for multiple coverage tests, the app superimposes the directivity curves on the same plot. The plot shows each directivity curve in a distinct color paired with a legend to help you distinguish which plot belongs to each coverage test. Using your pointer, you can hover over a curve to display the directivity's exact value at a particular location, as shown in the example below.

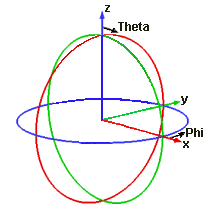
The orientation of the section planes follows the convention established in CST Studio Suite, as shown in the image below.

Accordingly, the predefined section planes available in the Antenna Placement app correspond to the section planes orthogonal to the global axes, as provided in the table below.
| Angular Definition | Section Plane |
|---|---|
| Phi = 0 | X-Z plane |
| Phi = 90 | Y-Z plane |
| Theta = 90 | X-Y plane |
Antenna Placement provides the option to define your own section planes to analyze radiation patterns.