User Interface | |||||||
|
| ||||||
The following figure illustrates the Performance Study window with a selected simulation process: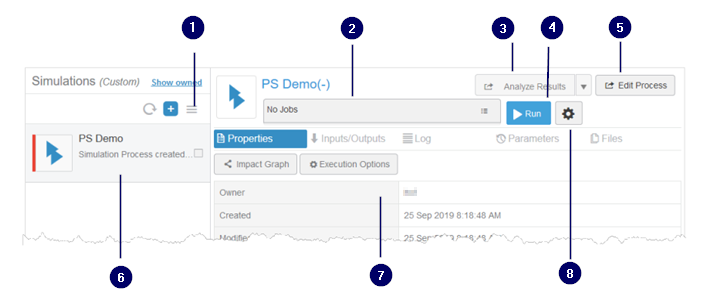
 Manage menu
 Monitor job
 Open in Results Analytics
 Run
Run Open in Process Composer
 Simulations panel
 Details panel
 Configure job and enter credentials
The Performance Study window is divided into the following two regions:
- Simulations Panel
-
The Simulations panel lists all the simulation processes to which you have access. If you have a large number of simulation processes in the Simulations panel, you can use 6WTags to display only the simulation processes of interest.
You can toggle on a simulation process in the Simulations panel and use the Manage menu
 to do
the following:
to do
the following:- Run the selected simulation processes.
- If the simulation process is running, open the app, if any, that is waiting for manual interaction from the user.
- Open one or more simulation processes in Results Analytics (assuming you have selected a Process Composer simulation process that has run and generated results).
- Delete or copy the simulation process.
- Create a revision of the simulation process.
- Change the lifecycle state of the simulation process or its sharing rights.
- Edit the settings of the simulation process.
In addition, when you toggle on two or more simulation processes, the following buttons appear:

- Click Group to group the selected processes into a simulation study. You can then use 6WTags to show only the simulation processes contained in a selected simulation study.
- Click Compare to display a comparison of the content (referenced and/or owned), attributes, and parameters in the selected simulation processes. In addition, if the simulation processes were created for Simulation Companion, Performance Study compares the tools that were used.
- Click Clear to toggle off the selected simulation processes.
- Details Panel
-
The Details panel shows information about the selected simulation process. The expandable regions allow you to do the following:
- View the properties of the simulation process.
- View the content and attributes of the simulation process.
- View the parameters that provide input into the simulation process and, if desired, change their value. You can also view the parameters that are output by the simulation process.
- Monitor the log from a job that was run by the simulation process.
- Monitor the value of the parameters while the job is running.
- View the files in the execution directories.
In addition, you can do the following:
- Click jobname to monitor the status of an running job.
- Click Start a new job to run the simulation process.
- Click Analyze Results to open the simulation process in Results Analytics (assuming you have selected a Process Composer simulation process that has run and generated results).
- Select Edit Process to edit the selected simulation process with the associated app—Process Composer or Simulation Companion. This button is available only if you have the necessary licensing and access rights to run the associated app and to edit the simulation process.