About Simulation Results | ||
| ||
You can visualize simulation results with the Physics Results Explorer app. Physics Results Explorer opens automatically after you run a simulation from a scenario creation app. Alternatively, you can open Physics Results Explorer from the Compass, and then open results data from the 3DEXPERIENCE Platform or import results from an external source. In either case, the results can be viewed with model plots, history plots, and sensors.
With Physics Results Explorer, you can interpret results data by doing the following:
- Create model plots based on contours, isocontours, or color coding.
- Create X-Y plots based on field or history data.
- Create ply stack plots to measure plies in a composites model.
- Measure results along streamlines or customized paths.
- Animate results to display results data for each frame.
- Generate reports to summarize the results for selected variables.
You can manipluate simulation results in various ways. You can:
- Mirror a part or section about an axis.
- Compare multiple plots in configurable views.
- Subdivide the model into display groups based on entities, parts, and values.
- highlight or expose areas of interest in the interior of a model using display groups or plot sectioning.
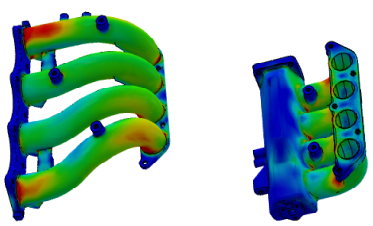
The left view shows the manifold above (in front of) the cutting plane. The right view shows the cut section and the portion of the manifold below (behind) the cutting plane.