-
From the Results section of the action bar, click
Results Monitoring
 . .
-
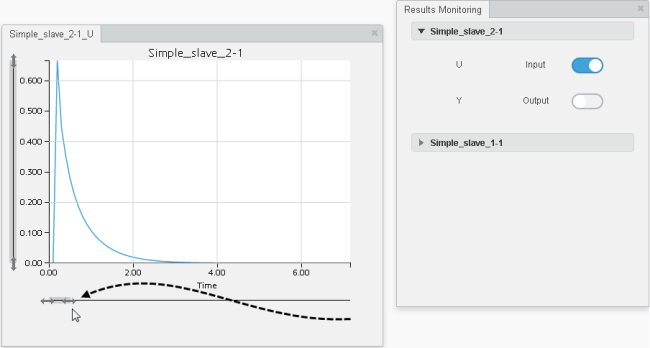
In the Results Monitoring panel, do the following:
- Expand the visible portion of the panel for the desired component.
- To activate each input or output you want to plot, slide the toggle switch to the right.
A separate X–Y plot window opens for each variable. - Optional:
You can change the portion of total time being displayed by dragging the arrowhead controls from the left or right side of the x-axis:
Similarly, you can use the y-axis arrowhead controls to change the visible portion of y-axis values. - Optional:
Move the pointer along the plotted line to display precise X–Y values at different points.
|