About Cumulative Frequency Plots | |
| |
A cumulative frequency plot is similar to a histogram, but each bar represents the cumulative
frequency for the span of values for the selected parameter.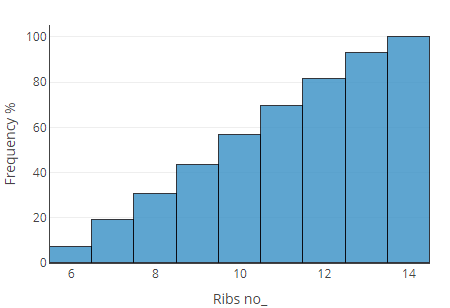
A cumulative frequency plot is similar to a histogram, but each bar represents the cumulative
frequency for the span of values for the selected parameter. | ||||||