About Histograms | |
| |
The X-axis is divided into a number ranges. The width of each bar represents the range of the
bin, and the height of each bar represents the number of data points in that range.
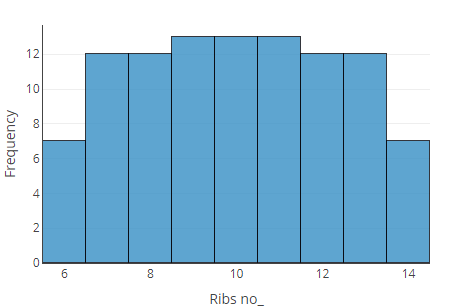
The X-axis is divided into a number ranges. The width of each bar represents the range of the
bin, and the height of each bar represents the number of data points in that range. | ||||||