About Collaboration | |||||
|
| ||||
After assigning objectives, thresholds, and priorities to the parameters in your data set, you use Results Analytics to score and rank the designs and to place a subset of potential designs in the basket for consideration as the recommended alternative. Different users, such as your peers or managers, can then use the Collaborate page to review your choices and to record their opinion of a design. They can adjust the weights assigned to the parameters and see the effect on the scores of the designs in the basket and the relative contribution of each parameter to the score. They can then choose to comment on the designs, to "like" an alternative that they think should be considered for a recommended alternative, or to recommended a different design.
The Weight Assigned to a Parameter
You can use the Parameter Weight sliders to adjust the weight assigned to a parameter that you defined as an objective. The Parameter Weight sliders are shown in the following figure for three parameters declared as objectives in the car shopping analytics case: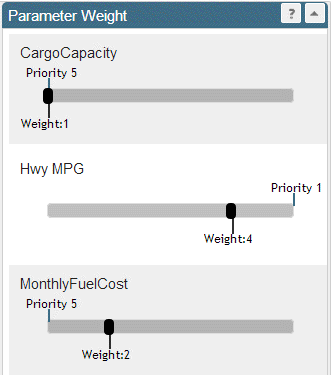
The Priority value shown in the figure is the priority you assigned to the parameter on the Define page. When Results Analytics initially scores the designs in the data set it calculates the weight, based on the priority you assigned. For example, when you assign a priority of 1, Results Analytics uses a weight of 5 when it initially calculates the scores.
When you adjust the weight on the Collaborate page, the weight that you assign overrides the weight calculated by Results Analytics. For example, in the previous example the user has decided to:
- Keep the weight of the Cargo Capacity parameter unchanged
- Reduce the significance of the Hwy MPG parameter.
- Increase the significance of the Monthly Fuel Cost parameter.
Rank and Score Breakdown
For each of the designs in the basket, the Collaborate page displays the Rank & Score Breakdown, as shown in the following figure:![]()
The example is shown for data point 3 (Alt 3), which was ranked eighth with a score of about 90. The Highway MPG parameter was assigned a high weight, and it accounts for most of the score. In contrast, the Cargo Capacity and Monthly Fuel Cost parameters were assigned low weights and account for a small portion of the score.
You can use the Parameter Weight sliders to adjust the weight assigned to a parameter and to view the effect on the rank and score and the individual contributions to the score from each objective.
Aggregated Weight Plots
The Aggregated Weight plot shows the relative weight of each objective—the proportion of the parameter's weight relative to the sum of all the parameter weights. An example of an Aggregated Weight plot is shown in the following figure: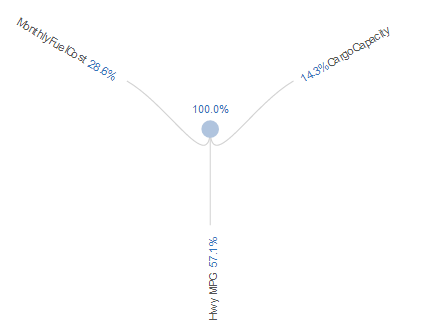
Parameter Groups
Any parameter groups that contain an objective appear in the Parameter Weight sliders on the Collaborate page and are displayed in the Rank & Score Breakdown and the Aggregated Weight plot. Consequently, you can adjust the weight of a group parameters and view the effect on the scoring and ranking for each alternative in the basket. For example, you could group the Highway MPG and City MPG parameters into a single group and view the influence of the group on the scoring and ranking. (Only the parameters in the group that you defined as objectives influence the scoring and ranking.)