About 2D Scatter Plots | ||||
|
| |||
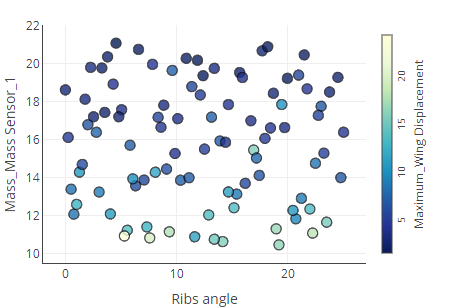
You can select the parameters to plot on the X- and Y-axes. Optionally, you can control the
color or size of the data points within the plot based on other parameters.
You can select the parameters to plot on the X- and Y-axes. Optionally, you can control the
color or size of the data points within the plot based on other parameters. | |||||||||