About 3D Scatter Plots | ||||
|
| |||
You can use 3D scatter plots to explore the relationship between three variables. Select
parameters for the X-, Y-, and Z-axes. Once created, you can rotate and zoom in on the plot to
analyze your
data.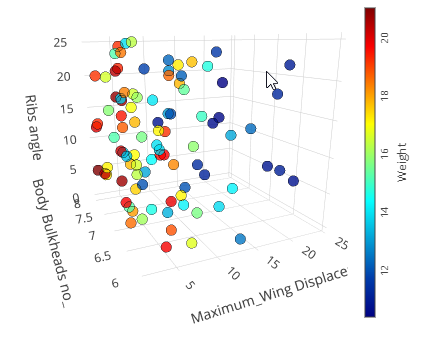
You can use 3D scatter plots to explore the relationship between three variables. Select
parameters for the X-, Y-, and Z-axes. Once created, you can rotate and zoom in on the plot to
analyze your
data. | |||||||||