About Capability Plots | ||||
|
| |||
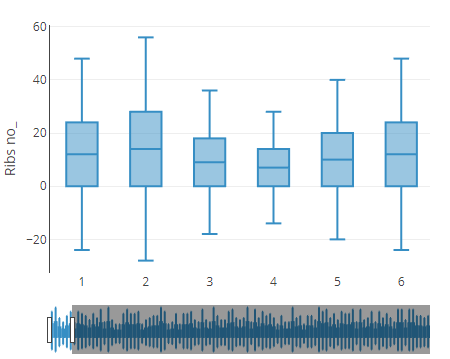
Each whisker is at the minimum and maximum value, or it is at three standard deviations above
and below the mean, whichever is closer to the mean. The mean is the line in the middle of the
box. The box extends to one standard deviation above and below the mean.