About Contour Plots | ||||
|
| |||
The contour plot changes depending on the inputs filtered in the canvas. The range of inputs changes the constants for the approximation.
The color represents an output parameter, and the color gradient shows change based on
changes in the input parameters measured on the X- and Y-axes.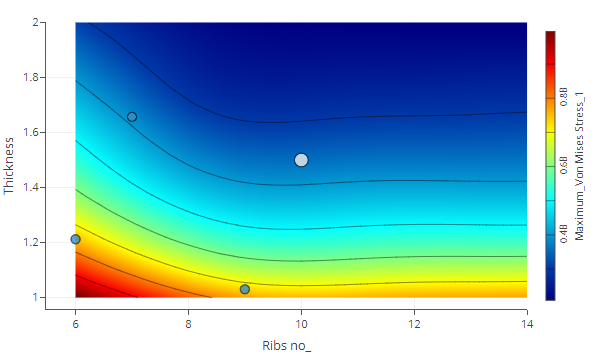
The point on the contour plot shows the nominals in your approximation. You can alter the
values of your nominal input parameters
from
the Nominals
![]() panel to the left of the canvas.
panel to the left of the canvas.