Feature Manager | |
| |
To display the Feature Manager, select Feature Manager
![]() from the standard area of the action bar.
Click the icons in the upper left
portion of the manager to change between Model
Data
from the standard area of the action bar.
Click the icons in the upper left
portion of the manager to change between Model
Data
![]() , Scenario Data
, Scenario Data
![]() , and Results Data
, and Results Data
![]() .
.
You can filter the view to display only specific model or scenario features and properties. Filtering allows you to search by name, definition, or invalid features. You can also filter to show scenario features only from the current step or load set.
| Feature Manager - Model Data |
|---|
 |
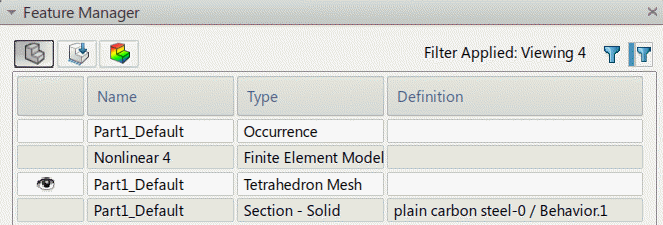
| For model data, the Feature Manager displays the parts, the active finite element model, mesh information, and material assignment for each part. |
| Feature Manager - Scenario Data | ||
|---|---|---|
 |
||
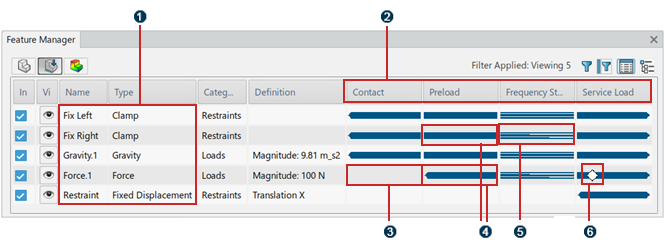
| Features | All step-dependent features that are defined and active during each step. | |
| Steps |
Steps determine the sequence of events in the analysis case. The state of the model at the end of one general step provides the initial model state for the start of the next general step. For example, you can use steps to capture changes in the loading and boundary conditions of the model. You can add a frequency step to calculate the natural modes and frequencies of your model. A frequency step is a linear perturbation step that does not account for nonlinear behavior. In addition, steps allow you to change the analysis procedure, the data output, and various controls. Note:
The number and type of steps available depend on which app you are using. Some apps support only a single step.
|
|
| No contribution | An empty cell in the column indicates that a feature does not contribute to that step. | |
| Active | A thick blue line in a column indicates that a feature is active during that step. | |
| Contributes/cannot change | Thin blue lines in a column indicates that a feature contributes to the state of the model in the linear perturbation analysis, but cannot be changed during that step. | |
| Modified | A white diamond icon on the blue line indicates that the feature is modified in that step. | |
For scenario data, you can view the data in two ways. You can list the scenario features alphabetically (as shown in the figure above), or you can display related scenario features in expandable nodes in a tree view. Nodes are displayed only for the features present in the analysis case.
The commands that are available depend on the context, and you cannot perform an action that results in an invalid sequence of steps. For example, you cannot start a feature before the first step, and you cannot deactivate a feature if it is a dependent step for the following step.
You can double-click a feature row to edit the feature using the standard dialog box and immersive field interface. The check box in the left column deactivates the feature in all steps of the analysis case (for apps that support analysis cases and multiple steps). Deactivating a feature has the same effect as deleting the feature; however, you can reactivate a deactivated feature, but you cannot restore a deleted feature. When multiple steps are available, you can right-click a column heading and deactivate the selected step. All of the features in that step are deactivated, and any feature that starts in the step is deactivated for all subsequent steps.
Right-clicking a column heading accesses controls to sort the feature rows according to the column values or to hide or show the selected column. When you sort a step column, features created in the current step appear first, followed by the features propagated to that step. You can also filter each column to show or hide particular features. In the figure above, the scenario data is filtered to show only Restraints and Loads.
| Feature Manager - Results Data |
|---|
 |
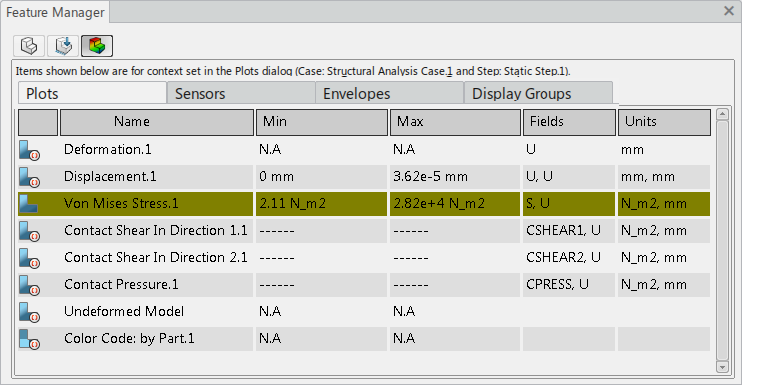
| For results data, the Feature Manager displays a summary of the minimum, maximum, fields, and units for each plot type. Deactivated plots do not show values for Min and Max unless they have been previously activated at least once. If Min and Max values are irrelevant (for example, for color code plots or for deformed and undeformed models) "N.A." is displayed in the table. If you modify the values, the table updates the values for activated plots, and deactivated plots show a row of dashes. Values are once again displayed for these plots when they are reactivated. Right-clicking a column heading accesses controls to sort the feature rows according to the column values or to hide or show the selected column. |
Right-clicking a feature in the manager displays a menu that allows you to do the following:
| Menu Item | Action |
|---|---|
| Edit | Edit the feature. |
| Deactivate/Activate | Deactivate or activate a feature.
For surface contact interactions, deactivate or reactivate in a subsequent step. |
| Plot type | Switch plot types. |
| Export | Export plot or sensor data to a .csv file. |
| Save as new template | Saves the plot data as a template in which you can customize which attributes are included. |
| Remove/Apply feature in step | Remove or apply the feature in the selected step
and all subsequent steps. Remove is for a
cell with a thick blue line (active feature), and
Apply is for an empty cell to the right
of an active cell. Applying a feature in a step applies it to all
subsequent steps. You cannot move a feature that was created in a perturbation step. You can move the created state of a propagated feature only between general steps; you cannot move the created state between general and linear steps. You cannot remove a feature that exists in only one step; you must delete it instead. |
| Start in Next or Previous Step | Start the feature in the next or previous valid step (not available if there is only one step). |
| Hide/Show | Hide or show the feature in the model area. |
| Locate | Reframe the model view on the selected feature. |
| Delete | Delete the feature. You cannot restore a deleted feature. |
You can Ctrl + [Click] or Shift + [Click] multiple features, and then you can press Delete to delete those features simultaneously. For results data, you can select or multiselect X-Y plots, right-click, and select Activate to make them visible in the X-Y Plots Viewer. When field sensors have parameters created for each step, load case, or frame, you can select View/Hide X-Y from the context menu to view sensor information in the X-Y Plots Viewer. Similarly, you can right-click the sensor and select Show/Hide annotation to show or hide the callout in the model. With multiselection, you can display more than one sensor in a single X-Y plot.