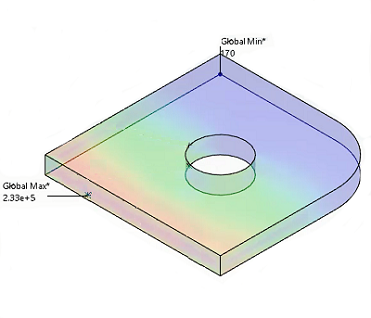
For element and nodal region-based values, these maxima and minima display as point clouds.
Point clouds are regions where both the extreme point and points close in value are
highlighted to indicate the regions where the maximum or minimum values reside.
You can adjust how many points are displayed in a point cloud by adjusting the tolerance values
for the maxima and minima. For example, in the example below, if you show maximum values
with a tolerance of 99.9%, the maximum values shown represent the upper 0.1% of the
overall range of available results values. You can also specify a limit on the number of
maximum or minimum values to display.

However, if you
decrease the tolerance to 70%, many possible maximum values exist in the point cloud.
Initially, there are four clusters, as shown in the figure below.

You
can choose to limit the count to a smaller number of results. In the example below, the
count is limited to two. The app
displays only two global maximum values because these are the only values that are
within the specified tolerance range and count limit.


