-
When the simulation completes, close the Simulation
Status dialog box.
The solved simulation opens in
Physics Results Explorer. The
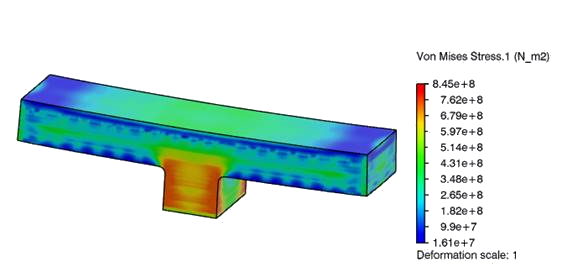
app displays a contour plot of von Mises stresses for the printed part after
removing the build tray and the supports, as shown below.
-
From the Plots dialog box, select Static
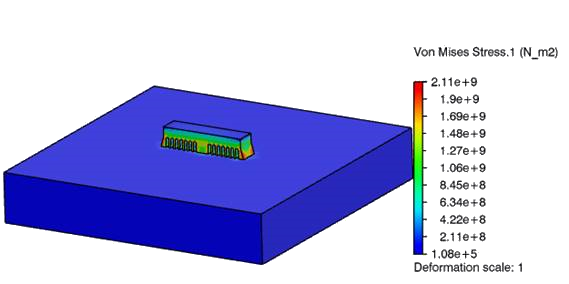
Step_Build as Step.
The von Mises stresses after printing the bridge part are
displayed.
-
From the Plots dialog box, select Static
Step_Annealing as Step.
The von Mises stresses after annealing the printed bridge part and the
build tray are displayed.
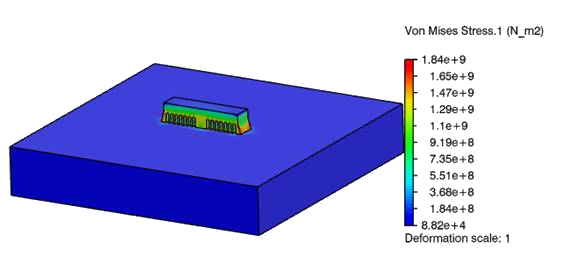
The maximum von Mises stress after annealing is 1.84 GPa;
the maximum before annealing was 2.11 GPa. This shows a 13% reduction in
stress.
The maximum von Mises stress after removing the build tray and
the supports is 0.85 GPa; the maximum before annealing was 2.11 GPa. This
shows more than a 50% reduction in stress.
-
From the Plots dialog box, select Static
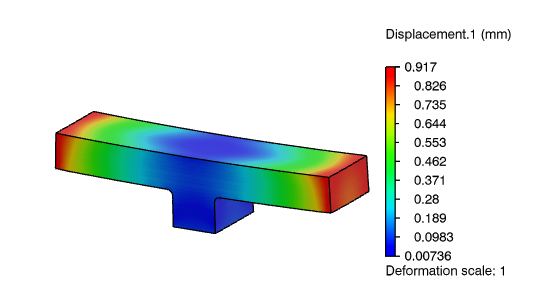
Step_Remove_Support as the Step, and
select Displacement.1 as the
Plot.
The distortion caused on the edges of the printed part are displayed
after removing the build tray and supports.
-
To review the displacement (distortion) of the printed part, do the
following:
-
From the Plots section of the action bar, click X-Y Plot from Field
 .
.
-
Name the plot Displacement_Plot.
-
From the Support options, select Node
sets, and select
Deflection.
-
From the Template options, select
Displacement.
-
Click OK.
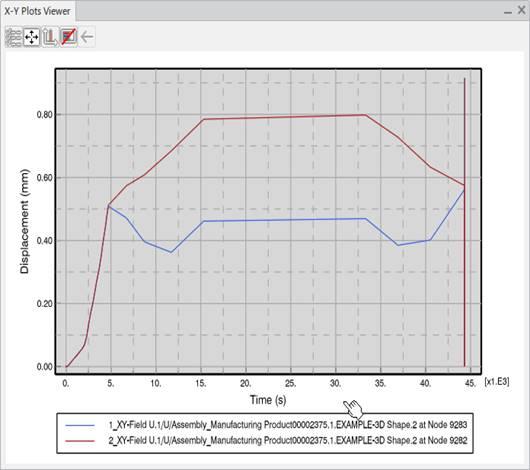
The graph below shows the distortion trend of the corner nodes
for the printed part.
-
From the X-Y Plot Viewer, select
Customize plot, charts, curves and axes
 .
.
-
From the Item section of the
Options, select the
Axis.
-
Enter 45100 for Max, and
44750 for Min, and
click X-Y Plot Viewer.
The graph below shows the distortion of the corner nodes during
the last two static steps.

The final distortion of the edges of the printed parts is < 0.9
mm.
-
Save your work.
Congratulations, you have successfully completed this example!