Generate Obscuration Plots | ||
| ||
-
From the Obscuration Plot section of the Assistant, click Obscuration Plot
 .
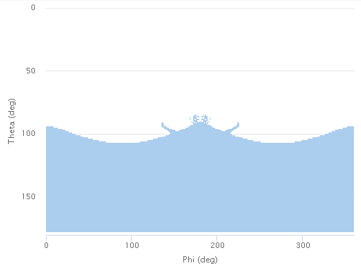
The app computes a one-time tessellation of the platform for each placement candidate's area of evaluation. Then, a dialog box opens and displays the obscuration plot for the first placement candidate you created.
.
The app computes a one-time tessellation of the platform for each placement candidate's area of evaluation. Then, a dialog box opens and displays the obscuration plot for the first placement candidate you created. -
From the Placement candidate options, select
Front Candidate to view the obscuration plot of the
placement candidate at the front of the passenger cabin.
The dialog box displays the obscuration plot. The blockage area is shown in blue, and the twin propellers are shown in the center of the plot.
-
View the obscuration plots for the middle candidate and the rear candidate, and
record their respective blockage areas.
Both obscuration plots display larger versions of the propellers, as shown below, because the placement candidates are located closer to the propellers than the frontmost placement candidate.

The blockage area results are as follows:
Placement Candidate Blockage Area Front Candidate 43.2% Middle Candidate 43.8% Rear Candidate 45.4% The rear candidate has a substantially larger blockage area than the front and middle placement candidates, so it is not worth the computational expense to simulate it. Do not simulate the rear candidate in the tasks that follow.