Analyze the Radiation Patterns
-
From the Radiation Patterns section of the Assistant, click Radiation Patterns
 .
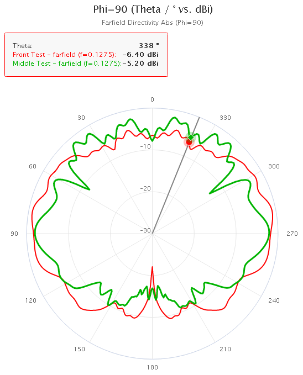
The app displays the far-field directivity curves of both coverage tests in the predefined section plane, Phi = 90° (that is, the X-Z plane.) Each curve is shown in a distinct color and paired with a legend to help you distinguish which plot belongs to which coverage test.
-
Analyze the far-field directivity curves.
The two curves are generally uniform and symmetrical. They are similar in the angular range of −120° (becoming more positive) to 120°, but they vary from 120° (becoming more positive) to 240°. For both coverage tests, there are no structures impeding the coverage above the installed antenna, which could explain the similarities between the curves. With regard to their dissimilarities, the front coverage test's curve has more coverage underneath the aircraft than the middle coverage test. You can attribute this difference to the aircraft's wings impeding the middle coverage test's coverage.
- Optional:
From the Section options, select a different section
plane.
As you did in the previous step, keep in mind how the aircraft's structure might affect the directivity curve.
The coverage tests have similar directivity curves in both the Theta = 90° and Phi = 0° section planes (that is, the X-Y and Y-Z planes, respectively.) - Close the dialog box.
 to specify a
requirement.
 .
.
 and then
click
  .
.
 , and then
click
  to select
the various 3D results available to you.