-
Use the Plots panel to change the analysis case and plot
type.
The Plots panel is visible whenever you are viewing the results,
unless you dock the panel and then hide that area to which it is docked.
-
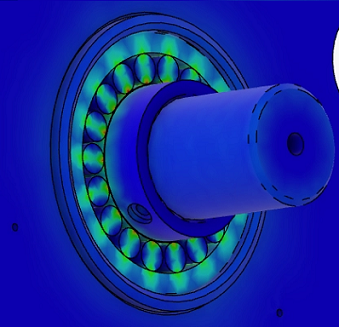
Review the Von Mises Stress for the global analysis.
Observe the stress concentrations on the contact points of the individual
rollers in the bearing.
You can view the results for any increment as the analysis was running. You can also click
Play Animation
 in the standard areaof the action bar or click the center of the Compass to animate the results. The results for the final increment of the analysis
are shown below.

-
In the Plots panel, change the
Case to Result Of Submodel
Analysis.
It is difficult to differentiate the global analysis results from the submodel
analysis results. This is likely because we did not choose to apply an extreme
load on the sprocket to accentuate the highest areas of stress. You can
experiment with the results by using either higher loading conditions or by
changing the mesh size specifications. For example, you can double the load on
the sprocket, or you can change the global mesh size from 10 mm to 20 mm. Either
option may create a more pronounced difference in the results.
-
Save your work.
Congratulations, you have successfully completed this
example!