Create a Display Group
-
From the Results section of the Assistant, click Display Group
 . .
-
Select Entities from the Item section,
and then select Surfaces from the Method
section.
A list of all surfaces from the model appears in the
Selection section.
-
Select Drone Surface from the options in the
Selection section, and click Replace
selected
 . .
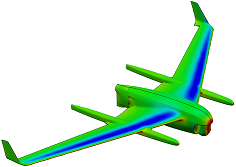
The fluid domain is replaced by the surface of the drone that is contained
within the fluid domain. The color scheme on the drone's surface depends on the active
plot selection in the Plots window. For example, a plot of the
gauge pressure is shown below.  -
In the Display Groups dialog box, click Create new
display group
 . .
-
Name the display group Drone Surface, and click
OK.
-
Click Close.
Visualize the Entire Drone
-
From the Display section of the action bar,
click Result Options
 . .
-
Click Model symmetry
 ,
and select Model symmetry. ,
and select Model symmetry.
-
From the Mirror section, clear all mirror planes and select
only XZ.
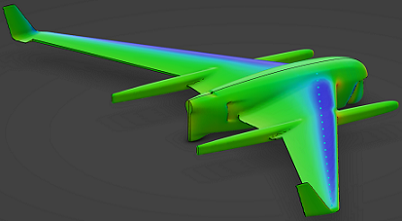
The 3D area mirrors
the display group you previously created, allowing you to visualize the results for the
entire drone.  -
Click Close.
Create Sensors for the Drag and Lift Forces
-
Create a sensor to display the last converged drag force value.
-
From the Sensors section of the action bar, click Sensor
 . .
-
From the Type options, select
History.
A history-based sensor allows you to display data collected by the history
output request. You created the history output request earlier to gather information
about the total fluid force against the portion of the drone inside the fluid
domain.
-
Name the sensor Drag Force.
-
From the Values section, select
FORCE from the Variable
options.
-
From the Quantity options, select Vector
Component 1.
Vector Component 1 corresponds to the X-axis, which is
the direction of airflow and, therefore, the direction associated with the drag
force.
-
From the Parameters section, clear all selections, and
select only Last.
The sensor will display the force from the last iteration
only.
-
Click OK.
-
Similarly, create a sensor named Lift Force to display the
last converged lift force value.
-
From the tree, expand to find the two new sensors you created and their values.
For the portion of the drone inside the fluid domain, the corresponding drag
and lift forces are approximately −14 N and 108 N, respectively. You can double these
values to determine the drag and lift forces for the entire drone. You can also use
these values to determine if the drone's design meets its requirements.
Calculate the Drag and Lift Coefficients
-
From the Tools section of the action bar,
click Formula
 . .
-
In the Formulas: Result Manager dialog box, create the
parameters required to calculate the drag and lift coefficients.
-
Create a parameter for the air density by double-clicking the text field to the
right of New Parameter of type and double-clicking
Density from the list.
-
Click New Parameter of type.
The Result Manager creates a single-value parameter with units of density
and displays it in the table.
-
Edit the name and value of the parameter to Air Density
and 1.205kg_m3, respectively, and click
Apply.
-
Similarly, create a parameter named Air Velocity with
units of velocity and a value of 22.352m_s.
-
Create a parameter named Projected Area for Drag with
units of area and a value of 0.327m2.
-
Create a parameter named Projected Area for Lift with
units of area and a value of 1.733m2.
-
Create drag and lift coefficient parameters with no assigned value.
Note:
For dimensionless parameters, select Real as
the unit type.
-
Select 'Drag Coefficient' from the table, and click
Add Formula to assign a formula to the drag coefficient
parameter.
The Formulas: Result Manager dialog box closes, and the
Formula Editor dialog box opens.
-
Search the Dictionary for Parameters
and Operators, and double-click items you need to add to recreate
the equation for the drag coefficient.
For more information about the equation (that is,
), see the Problem Description.
The formula reads as follows: 2 * `Result Of Flow Analysis
Case.1\Drag Force\Last` / (`Projected Area for Drag` * `Air Density` * `Air Velocity`
** 2).
-
Click OK.
-
Similarly, select 'Lift Coefficient' from the table, and
recreate the equation for the lift coefficient.
-
Click OK to close the Formula Editor
dialog box and to close the Formulas: Result Manager dialog
box.
-
From the tree, expand to find the drag and lift coefficients you created and their
values.
You calculated the drag and lift coefficients using parameters that consider a
half-symmetry model. In cases where a full model value is required, you may need to
double half-symmetry parameters before you create these formulas. If you rerun the
simulation with some variations to the scenario, you will see the results of the drag
and lift coefficients immediately after the simulation completes.
The drag and lift coefficients are approximately −0.14 and 0.21, respectively.
You can use these values to determine if the drone's design meets its
requirements.
Generate Streamline Contours
Congratulations, you have successfully completed this
example!
|
 .
.
 .
.
 to see
the original display.The fluid domain is replaced by the surface of the drone that is contained within the fluid domain. The color scheme on the drone's surface depends on the active plot selection in the Plots window. For example, a plot of the gauge pressure is shown below.
 .
.
 ,
and select

 to click
two points on the drone's surface.


