Simulate the Airflow
-
From the Simulate section of the Assistant, click Model and Scenario Checks
 . .
This option generates the mesh first, and then it validates the features that you
defined using the Assistant, action bar,
and tree.
-
Close the Model and Scenario Checks Status dialog box.
-
From the Simulate section of the Assistant, click Simulate
 . .
-
From the License options, select
Tokens.
-
Click OK.
The Simulation Status window appears, and the
simulation iterates until the convergence value falls below the residual thresholds or
until it reaches the maximum number of iterations. You can monitor the progress by
navigating to the Plots tab and then selecting any of the
variables from the Plot Variable options. Once the simulation
converges, the Plots window opens with the total number of
increments noted.
View the Status Plots
-
From the Plot Variable options, select Output.2:
X-Average Force.
The X-average force is the force experienced by the portion of the drone inside the
fluid domain in the direction of airflow. In other words, this is the drag force on half
of the drone.
The plot indicates that the drag force reaches a stable plateau. 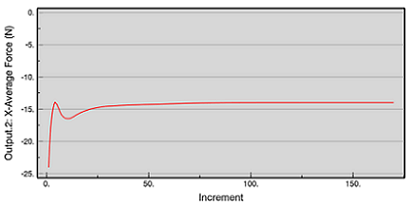 -
From the Plot Variable options, select Output.2:
Z-Average Force.
The Z-average force is the force experienced by the portion of the drone inside the
fluid domain in the direction above and below the drone. In other words, this is the
lift force on half of the drone.
The plot indicates that the lift force reaches a stable plateau. 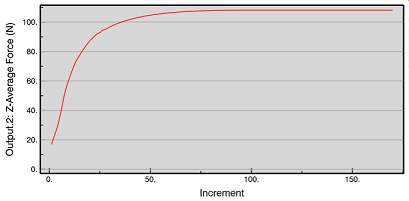 -
Observe the residuals in the momentum and turbulence simulation status plots.
All plots stabilize near the point of convergence, meaning the simulation
converged properly.
-
Close the Simulation Status window.
|