Analyze the Results | ||
| ||
-
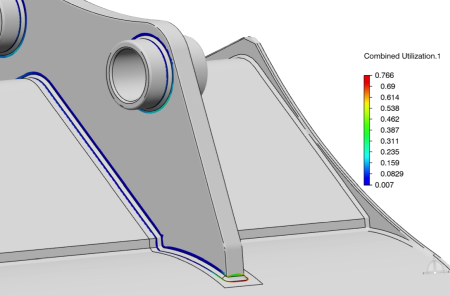
From the Plot options, select Combined
Utilization.
The plot shows utilization contours at the edges of the weld bead, as shown below.
-
From the context menu, select Show Min/Max Values
 to identify the location of the maximum utilization factor.
The display indicates the location of the maximum and minimum values for the utilization factor. You can use the values and location to predict the onset of failure.

Congratulations, you have successfully completed this example!