Review and Interpret the Plots
-
Display a cross-section of the heat exchanger that shows both the inlet and outlet
nozzles.
-
From the Results section of the Assistant, click Plot Sectioning
 .
A plane that is perpendicular to the Z-axis cuts the heat exchanger in half, such that the 3D area displays only a cross-section of the model.
 -
In the context toolbar, hover over Reverse cut
 , and
click Set cut normal as Y axis
 .
.
-
Click OK
 .
.
-
From the Results section of the Assistant, click Plot Sectioning
-
In the Plots window, do the following:
-
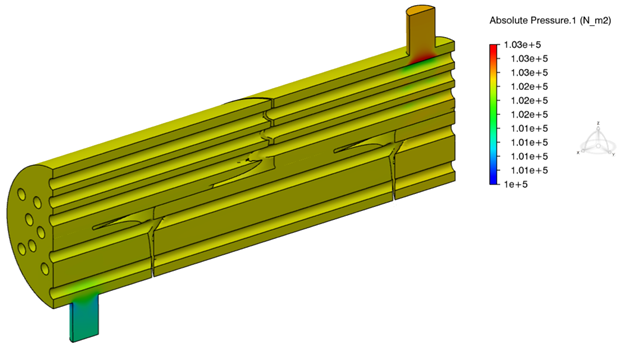
From the Plot options, select Absolute
Pressure.1 to display the absolute pressure of the water throughout
the heat exchanger.

The pressure range is very small. While the pressure is stable throughout the heat exchanger, the greatest variation occurs at the nozzles.
-
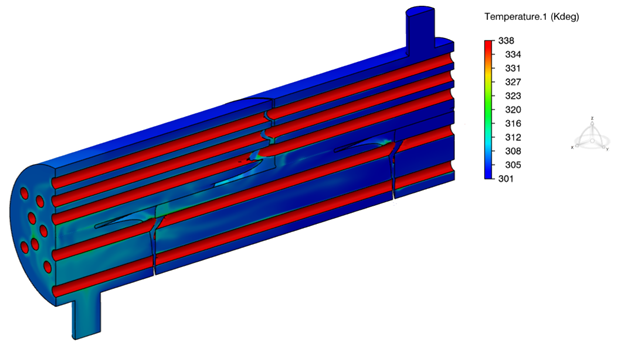
Change your selection to Temperature.1 to display the
temperature of the water throughout the heat exchanger.

The water appears to warm up while flowing through the last 25% of the heat exchanger.
-
From the Plot options, select Absolute
Pressure.1 to display the absolute pressure of the water throughout
the heat exchanger.
