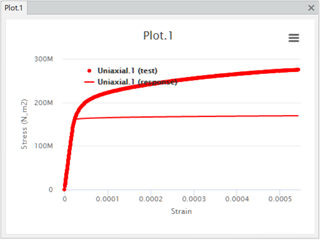
The
app adds parameters for isotropic elasticity and isotropic Johnson-Cook
plasticity to the
Material model section of the
Calibration Setup panel. For each parameter, the
app provides an initial value.
The app also computes the initial responses based on these parameters and plots a
response curve on the same plot as the test data. The response curve is red,
the same color as the plot of the test data
points.
