-
Open a native client on the 3DEXPERIENCE platform.
The technique that you use to open a native client depends on your installation and
environment. For example, you can open a client from a desktop shortcut or from
an email invitation to a 3DDashboard. For more information, see the Getting Started
guide.
-
From the Compass, click Material Calibration.
The app opens and displays the Calibration Setup panel. This
panel provides access to most of the actions you need to complete a calibration:
loading the test data, selecting a material model, plotting test data and
material response, and adjusting parameters before running a
calibration.
-
From the top of the Calibration Setup panel, click
Test Data
 . .
-
From the file selection dialog box that appears, navigate to the test data for
A356 aluminum (EXAMPLE-Aluminum-TestData.txt), and click
OK.
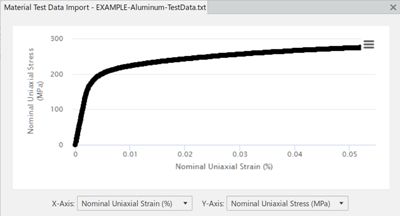
The Material Test Data Import dialog box appears
with your data displayed in a table.
-
Name the material test data Uniaxial.
-
From the Domain options, select
Time.
You can import either time- or frequency-based test data. The test data for this example
is in the time domain.
-
From the Deformation mode options, select
Uniaxial.
-
From the Delimiters section, select Tab
only.
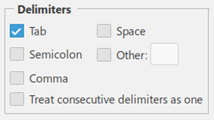
You select tabs because the data points in
EXAMPLE-Aluminum-TestData.txt are delimited with
tabs.
-
Start the import of material test data at row 2.
Starting the import process with the second row skips the header information in the first
row.
-
Click Next.
The Material Test Data Import dialog box displays the
imported data in an X-Y plot and in tabular format.  You can modify the header of the data table to relabel the type of test
data in each column. -
Relabel Column 1 as the Nominal Uniaxial
Strain (%), and relabel Column 2 as the
Nominal Uniaxial Stress (MPa).
-
From the X-Axis options, select Nominal Uniaxial Stress
(MPa); and from the Y-Axis options,
select Nominal Uniaxial Strain (%).
-
Click Finish.
The app opens the Plot panel and plots the test data points in
red. 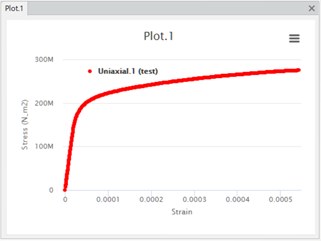 In the Calibration Setup panel, the imported
test data (Uniaxial.1) appears in the
Test
Data Sets
section; and the plot of the test data (Plot.1)
appears in the Plots section.
|