Customize the Plot Display | ||
| ||
-
In the upper-right corner of the Plot panel, click
Settings
 .
The Settings dialog box appears.
.
The Settings dialog box appears. -
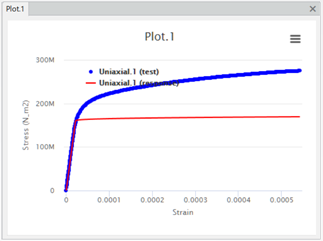
Change the color of the Uniaxial.1(test) curve to blue.
The app displays the plotted points in blue in the X-Y plot.