Analyze the Results | ||
| ||
-
When the simulation completes, Physics Results Explorer displays the von Mises stress contour plot for the last solution step.
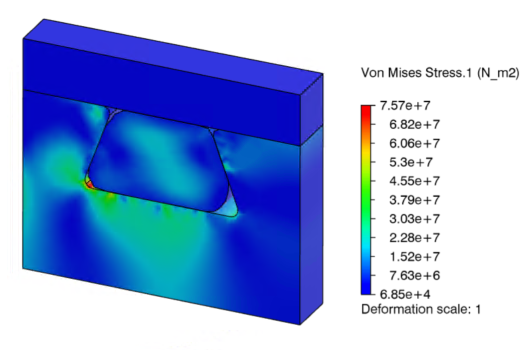
The global max of the von Mises stress value is 7.57e+7 N/m2, which is less than the material yield value of 2.068e+8 N/m2. -
To display the maximum value in a contour plot, do the following:
-
From the Display section of the action bar, click Show Min/Max values
 .
.
-
In the context toolbar, select Show only Max value
 , and click OK
 .
.
-
From the Display section of the action bar, click Show Min/Max values
-
To display the displacement plot, do the following:
- In the Plots panel, from the Plot options, select Displacement.1.
-
Select the last row to display the results of the last time increment
in the static step.
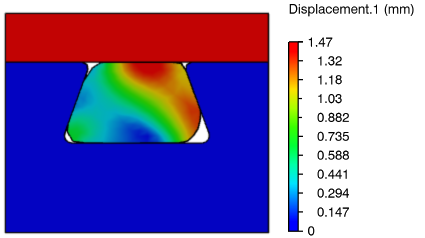
The top plate has a maximum displacement of 1.47 mm, as expected. The deformed shape of the O-ring indicates that it stretches laterally as the top plates pushes it into the groove. The O-ring's maximum compression ratio is 1.47 / 5.64 = 26%, which is an acceptable ratio (5.64 mm is the largest diameter of the undeformed O-ring's cross-section). For most elastomer O-rings used as static seals, the maximum recommended compression ratio is 30%.
-
Display the contact pressure contour plot, and configure it to show only the
results of the O-ring.
- In the Plots panel, from the Plot options, select Contact Pressure.1.
-
From the Display section of the action bar, click Display Group
 .
.
- Clear the Top plate and Groove options.
-
Click Replace selected
 to display only the O-ring's results, and click
Close.
to display only the O-ring's results, and click
Close.

The contact pressure results are visible for the O-ring only. The contact pressure is highest at the top and bottom surfaces of the O-ring, and considerable pressure developed between the side surfaces of the O-ring and the groove walls. The O-ring seals the vacuum chamber efficiently.The percentage of volume that an O-ring's cross-section displaces in its confining space (or gland) is called “gland fill.” Most O-ring seal applications require a gland fill between 60% to 85% of the available volume, with an optimum fill being 75% (or 25% void). It is essential to allow at least a 10% void in any elastomer sealing gland to compensate for thermal expansion and O-ring swell.
Congratulations, you have successfully completed this example!